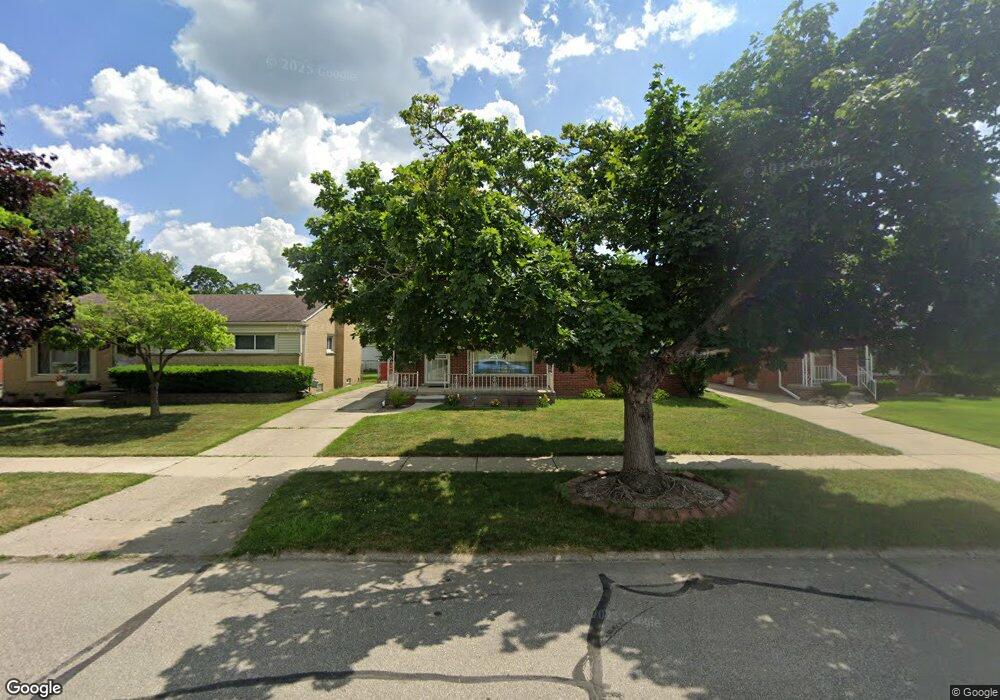
8836 Salem Redford, MI 48239
Estimated Value: $180,000 - $228,000
--
Bed
1
Bath
1,083
Sq Ft
$185/Sq Ft
Est. Value
About This Home
This home is located at 8836 Salem, Redford, MI 48239 and is currently estimated at $199,817, approximately $184 per square foot. 8836 Salem is a home located in Wayne County with nearby schools including John D. Pierce Middle School, Lee M. Thurston High School, and Global Heights Academy.
Ownership History
Date
Name
Owned For
Owner Type
Purchase Details
Closed on
Jan 31, 2009
Sold by
Towns Shirley
Bought by
Washington Judy
Current Estimated Value
Purchase Details
Closed on
Jan 8, 2007
Sold by
Mortgage Electronic Registration Systems
Bought by
Wells Fargo Bank Na and Securitized Asset Backed Receivables Llc
Purchase Details
Closed on
Dec 6, 2006
Sold by
Kantos Stephen
Bought by
Mortgage Electronic Registration Systems
Purchase Details
Closed on
Apr 6, 1998
Sold by
Kantos Elveria M
Bought by
Kantos Stephen
Create a Home Valuation Report for This Property
The Home Valuation Report is an in-depth analysis detailing your home's value as well as a comparison with similar homes in the area
Home Values in the Area
Average Home Value in this Area
Purchase History
| Date | Buyer | Sale Price | Title Company |
|---|---|---|---|
| Washington Judy | -- | Hometown One Title Agency Ll | |
| Wells Fargo Bank Na | -- | None Available | |
| Mortgage Electronic Registration Systems | $162,524 | None Available | |
| Kantos Stephen | -- | -- |
Source: Public Records
Tax History Compared to Growth
Tax History
| Year | Tax Paid | Tax Assessment Tax Assessment Total Assessment is a certain percentage of the fair market value that is determined by local assessors to be the total taxable value of land and additions on the property. | Land | Improvement |
|---|---|---|---|---|
| 2025 | $767 | $90,000 | $0 | $0 |
| 2024 | $767 | $83,200 | $0 | $0 |
| 2023 | $734 | $74,000 | $0 | $0 |
| 2022 | $2,161 | $65,400 | $0 | $0 |
| 2021 | $2,100 | $61,900 | $0 | $0 |
| 2020 | $2,369 | $52,500 | $0 | $0 |
| 2019 | $2,027 | $46,200 | $0 | $0 |
| 2018 | $661 | $39,100 | $0 | $0 |
| 2017 | $2,287 | $36,500 | $0 | $0 |
| 2016 | $1,783 | $37,200 | $0 | $0 |
| 2015 | $2,777 | $33,900 | $0 | $0 |
| 2013 | $2,690 | $27,400 | $0 | $0 |
| 2012 | $1,635 | $30,100 | $7,400 | $22,700 |
Source: Public Records
Map
Nearby Homes