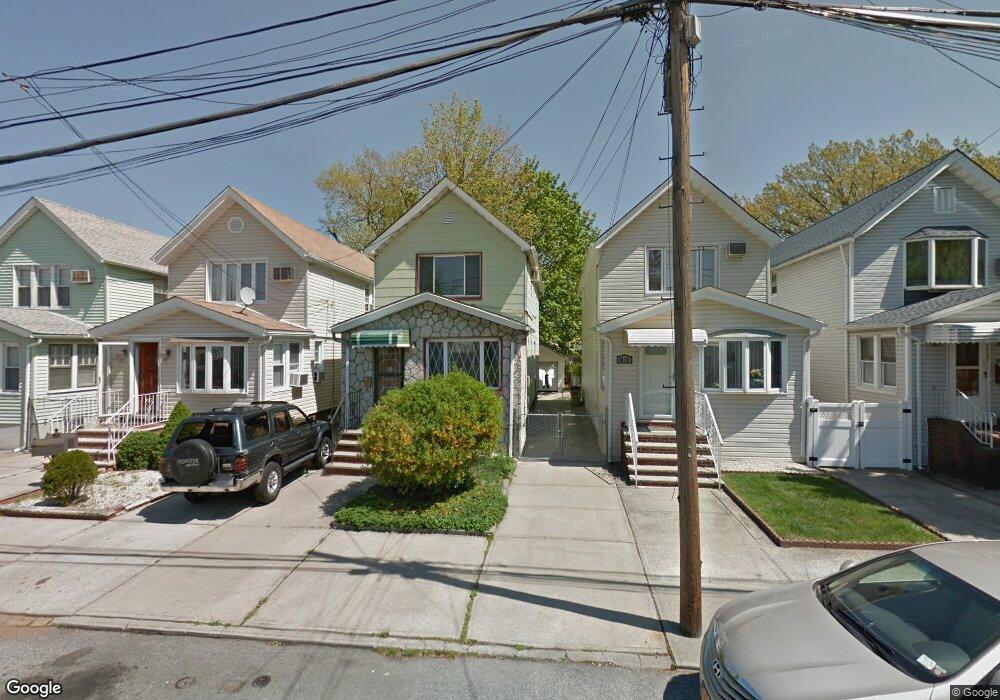
8838 69th Rd Forest Hills, NY 11375
Forest Hills NeighborhoodEstimated Value: $835,574 - $960,000
--
Bed
--
Bath
1,216
Sq Ft
$744/Sq Ft
Est. Value
About This Home
This home is located at 8838 69th Rd, Forest Hills, NY 11375 and is currently estimated at $904,894, approximately $744 per square foot. 8838 69th Rd is a home located in Queens County with nearby schools including Ps 144 Col Jeromus Remsen, J.H.S. 190 Russell Sage, and Queens Metropolitan High School.
Ownership History
Date
Name
Owned For
Owner Type
Purchase Details
Closed on
Jan 18, 2007
Sold by
Vagts Arlene J
Bought by
Belalcazar Francia and Serna Ricardo
Current Estimated Value
Home Financials for this Owner
Home Financials are based on the most recent Mortgage that was taken out on this home.
Original Mortgage
$78,000
Outstanding Balance
$46,719
Interest Rate
6.16%
Estimated Equity
$858,175
Purchase Details
Closed on
Jul 31, 2006
Sold by
Oppedisano Frank
Bought by
Vagts Arlene J
Home Financials for this Owner
Home Financials are based on the most recent Mortgage that was taken out on this home.
Original Mortgage
$499,500
Interest Rate
6.8%
Mortgage Type
Purchase Money Mortgage
Purchase Details
Closed on
Mar 5, 1997
Sold by
Kress Robert B and Schmidinger Fred
Bought by
Oppedisano Frank and Oppedisano Patricia
Create a Home Valuation Report for This Property
The Home Valuation Report is an in-depth analysis detailing your home's value as well as a comparison with similar homes in the area
Home Values in the Area
Average Home Value in this Area
Purchase History
| Date | Buyer | Sale Price | Title Company |
|---|---|---|---|
| Belalcazar Francia | $591,000 | -- | |
| Belalcazar Francia | $591,000 | -- | |
| Vagts Arlene J | $555,000 | -- | |
| Vagts Arlene J | $555,000 | -- | |
| Oppedisano Frank | $137,000 | First American Title Ins Co | |
| Oppedisano Frank | $137,000 | First American Title Ins Co |
Source: Public Records
Mortgage History
| Date | Status | Borrower | Loan Amount |
|---|---|---|---|
| Open | Belalcazar Francia | $78,000 | |
| Closed | Belalcazar Francia | $78,000 | |
| Open | Belalcazar Francia | $472,800 | |
| Closed | Belalcazar Francia | $472,800 | |
| Previous Owner | Vagts Arlene J | $499,500 |
Source: Public Records
Tax History Compared to Growth
Tax History
| Year | Tax Paid | Tax Assessment Tax Assessment Total Assessment is a certain percentage of the fair market value that is determined by local assessors to be the total taxable value of land and additions on the property. | Land | Improvement |
|---|---|---|---|---|
| 2025 | $6,962 | $36,743 | $9,701 | $27,042 |
| 2024 | $6,962 | $34,664 | $10,961 | $23,703 |
| 2023 | $6,569 | $32,704 | $8,789 | $23,915 |
| 2022 | $6,159 | $48,300 | $14,400 | $33,900 |
| 2021 | $6,493 | $49,440 | $14,400 | $35,040 |
| 2020 | $6,481 | $48,360 | $14,400 | $33,960 |
| 2019 | $6,043 | $49,140 | $14,400 | $34,740 |
| 2018 | $5,556 | $27,253 | $8,343 | $18,910 |
| 2017 | $5,241 | $25,712 | $8,442 | $17,270 |
| 2016 | $5,140 | $25,712 | $8,442 | $17,270 |
| 2015 | $2,926 | $25,516 | $10,579 | $14,937 |
| 2014 | $2,926 | $24,073 | $10,987 | $13,086 |
Source: Public Records
Map
Nearby Homes
- 90-15 70th Dr
- 100-33 Metropolitan Ave
- 8831 69th Ave
- 9010 70th Dr
- 8810 70th Rd
- 70-27 Olcott St
- 91-35 71st Ave
- 88-03 70th Dr
- 91-48 71st Ave
- 92-11 70th Ave
- 68-15 Selfridge Stre 68-15 Selfridge St Unit 5G
- 90-60 Union Turnpike Unit 9E
- 68-40 Manse St
- 68-15 Selfridge St Unit 5D
- 68-15 Selfridge St Unit 1J
- 70-19 Manse St
- 68-20 Selfridge St Unit 6H
- 68-20 Selfridge St Unit 6J
- 93-25 71st Dr
- 90-50 Union Turnpike Unit 17K