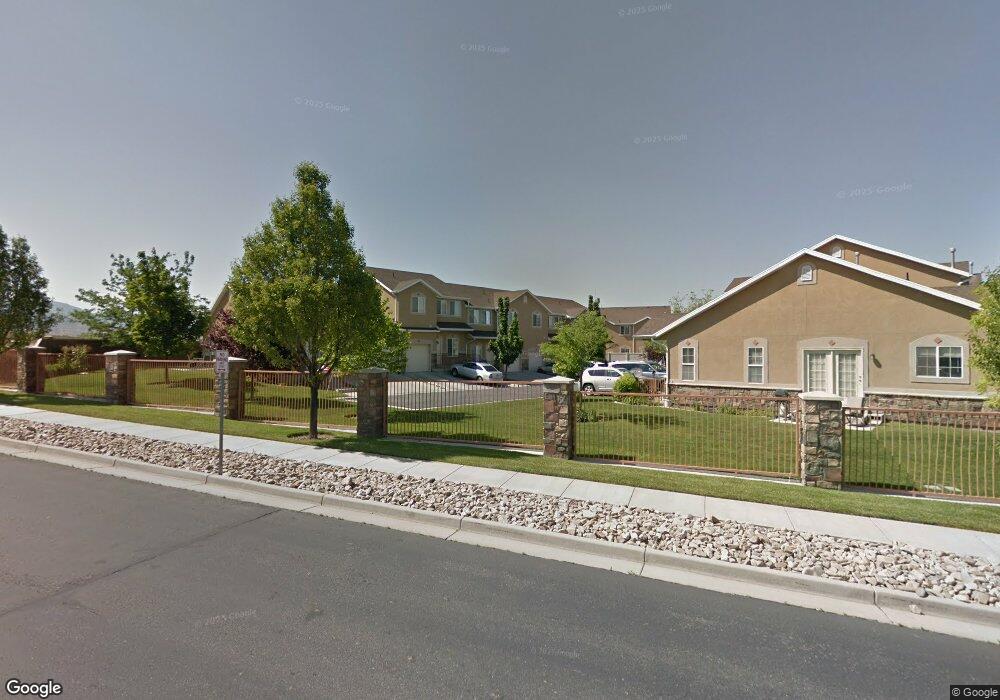
8838 Humboldt Ct West Jordan, UT 84081
Copper Hills NeighborhoodEstimated Value: $359,000 - $403,000
3
Beds
2
Baths
1,320
Sq Ft
$291/Sq Ft
Est. Value
About This Home
This home is located at 8838 Humboldt Ct, West Jordan, UT 84081 and is currently estimated at $384,371, approximately $291 per square foot. 8838 Humboldt Ct is a home located in Salt Lake County with nearby schools including Copper Canyon School, West Hills Middle School, and Copper Hills High School.
Ownership History
Date
Name
Owned For
Owner Type
Purchase Details
Closed on
Mar 25, 2008
Sold by
Cooper Heidi
Bought by
Sanders Jamie A and Mechanthouse Greg M
Current Estimated Value
Purchase Details
Closed on
Jun 30, 2006
Sold by
Bowcutt C Jared and Bowcutt Jullynda
Bought by
Cooper Heidi
Home Financials for this Owner
Home Financials are based on the most recent Mortgage that was taken out on this home.
Original Mortgage
$35,780
Interest Rate
6.18%
Mortgage Type
Stand Alone Second
Purchase Details
Closed on
Oct 13, 2004
Sold by
Copper Hills Development Llc
Bought by
Bowcutt C Jared and Bowcutt Jillynda
Home Financials for this Owner
Home Financials are based on the most recent Mortgage that was taken out on this home.
Original Mortgage
$127,300
Interest Rate
5.25%
Mortgage Type
Purchase Money Mortgage
Create a Home Valuation Report for This Property
The Home Valuation Report is an in-depth analysis detailing your home's value as well as a comparison with similar homes in the area
Home Values in the Area
Average Home Value in this Area
Purchase History
| Date | Buyer | Sale Price | Title Company |
|---|---|---|---|
| Sanders Jamie A | -- | Equity Title | |
| Cooper Heidi | -- | First American Title | |
| Bowcutt C Jared | -- | Integrated Title Ins Svcs |
Source: Public Records
Mortgage History
| Date | Status | Borrower | Loan Amount |
|---|---|---|---|
| Previous Owner | Cooper Heidi | $35,780 | |
| Previous Owner | Cooper Heidi | $143,120 | |
| Previous Owner | Bowcutt C Jared | $127,300 |
Source: Public Records
Tax History Compared to Growth
Tax History
| Year | Tax Paid | Tax Assessment Tax Assessment Total Assessment is a certain percentage of the fair market value that is determined by local assessors to be the total taxable value of land and additions on the property. | Land | Improvement |
|---|---|---|---|---|
| 2025 | $1,714 | $330,800 | $99,200 | $231,600 |
| 2024 | $1,714 | $329,700 | $98,900 | $230,800 |
| 2023 | $1,710 | $310,000 | $93,000 | $217,000 |
| 2022 | $1,834 | $327,200 | $98,100 | $229,100 |
| 2021 | $1,403 | $227,800 | $68,300 | $159,500 |
| 2020 | $1,461 | $222,600 | $66,800 | $155,800 |
| 2019 | $1,383 | $206,700 | $62,000 | $144,700 |
| 2018 | $1,267 | $187,800 | $56,300 | $131,500 |
| 2017 | $1,165 | $172,000 | $51,600 | $120,400 |
| 2016 | $1,118 | $155,000 | $46,500 | $108,500 |
| 2015 | $1,091 | $147,500 | $44,200 | $103,300 |
| 2014 | $1,097 | $146,000 | $43,800 | $102,200 |
Source: Public Records
Map
Nearby Homes
- 5582 Washoe Cove
- 8793 S Big Bar Ct
- 8854 Rocky Creek Dr
- 9118 S Wisteria Way
- 8453 S Windmill Dr
- 8441 S Spratling Dr
- 5098 Cherry Laurel Ln
- 8501 S Michele River Ave
- 8501 S Michele River Ave Unit 116
- 5946 W Eric Mountain Ln Unit 103
- 5946 W Eric Mountain Ln
- 5958 W Eric Mountain Ln
- 5958 W Eric Mountain Ln Unit 104
- 7214 S Sage Run Rd
- 5746 W Swift Creek Rd
- 8577 Autumn Gold Cir
- Larsen Plan at Copperhaven by Toll Brothers
- Brooke Plan at Copperhaven by Toll Brothers
- 8524 S Michele River Ave
- 5719 W Boulder Creek Rd
- 8838 S Humboldt Ct
- 8832 Humboldt Ct Unit 5
- 8832 S Humboldt Ct
- 8832 S Humboldt Ct Unit 8832
- 8846 S Humboldt Ct
- 8846 Humboldt Ct
- 8852 Humboldt Ct
- 8852 S Humboldt Ct
- 5581 Tungsten Ct
- 5577 W Tungsten Ct
- 5581 W Tungsten Ct
- 8858 Humboldt Ct
- 5577 Tungsten Ct
- 5573 Tungsten Ct
- 5587 W Tungsten Ct
- 5587 Tungsten Ct
- 5573 W Tungsten Ct
- 8835 Humboldt Ct
- 8843 S Humboldt Ct
- 8835 S Humboldt Ct