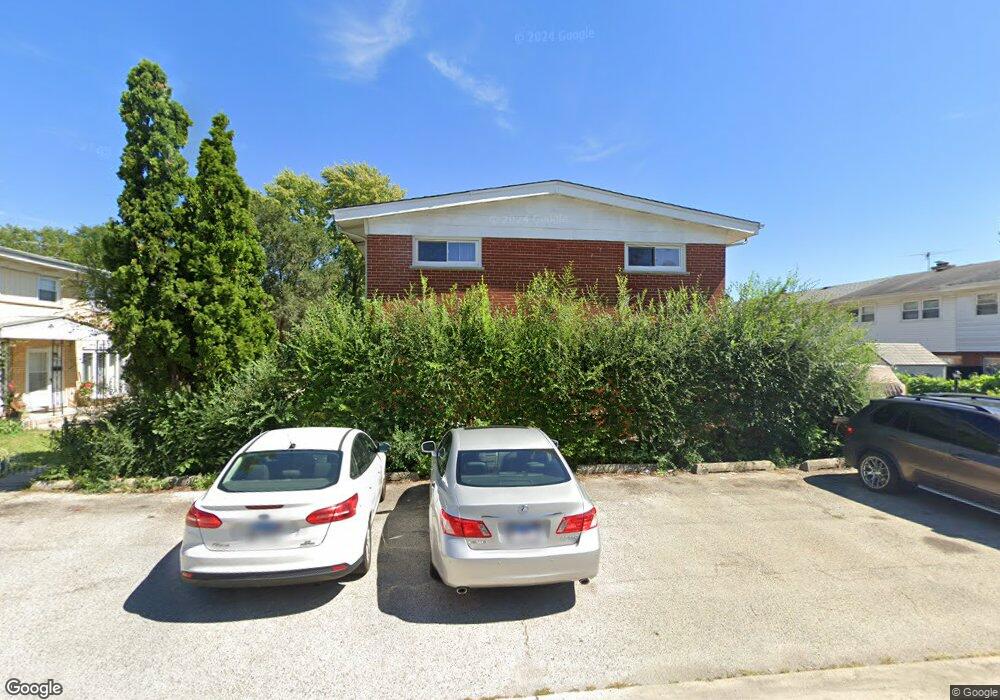
8838 Robin Dr Des Plaines, IL 60016
Estimated Value: $224,000 - $253,000
2
Beds
1
Bath
1,104
Sq Ft
$219/Sq Ft
Est. Value
About This Home
This home is located at 8838 Robin Dr, Des Plaines, IL 60016 and is currently estimated at $241,239, approximately $218 per square foot. 8838 Robin Dr is a home located in Cook County with nearby schools including Apollo Elementary School, Gemini Middle School, and Maine East High School.
Ownership History
Date
Name
Owned For
Owner Type
Purchase Details
Closed on
Jan 22, 2014
Sold by
Us Bank National Association
Bought by
Ansari Afzal
Current Estimated Value
Purchase Details
Closed on
Oct 8, 2013
Sold by
Solis Juan
Bought by
Us Bank Na
Purchase Details
Closed on
Nov 3, 2004
Sold by
Olmos Maurilio and Olmos Teresa R
Bought by
Solis Juan
Home Financials for this Owner
Home Financials are based on the most recent Mortgage that was taken out on this home.
Original Mortgage
$168,000
Interest Rate
6.87%
Mortgage Type
Unknown
Purchase Details
Closed on
Apr 30, 1998
Sold by
Tayag Emilio and Tayag Edgardo
Bought by
Olmos Maurilio and Olmos Teresa R
Home Financials for this Owner
Home Financials are based on the most recent Mortgage that was taken out on this home.
Original Mortgage
$111,401
Interest Rate
7.19%
Mortgage Type
FHA
Create a Home Valuation Report for This Property
The Home Valuation Report is an in-depth analysis detailing your home's value as well as a comparison with similar homes in the area
Home Values in the Area
Average Home Value in this Area
Purchase History
| Date | Buyer | Sale Price | Title Company |
|---|---|---|---|
| Ansari Afzal | $100,000 | First American Title | |
| Us Bank Na | -- | None Available | |
| Solis Juan | $210,000 | Atgf Inc | |
| Olmos Maurilio | $112,000 | Professional National Title |
Source: Public Records
Mortgage History
| Date | Status | Borrower | Loan Amount |
|---|---|---|---|
| Previous Owner | Solis Juan | $168,000 | |
| Previous Owner | Olmos Maurilio | $111,401 | |
| Closed | Solis Juan | $31,500 |
Source: Public Records
Tax History
| Year | Tax Paid | Tax Assessment Tax Assessment Total Assessment is a certain percentage of the fair market value that is determined by local assessors to be the total taxable value of land and additions on the property. | Land | Improvement |
|---|---|---|---|---|
| 2025 | $5,691 | $19,000 | $2,876 | $16,124 |
| 2024 | $5,691 | $21,000 | $3,500 | $17,500 |
| 2023 | $5,413 | $21,000 | $3,500 | $17,500 |
| 2022 | $5,413 | $21,000 | $3,500 | $17,500 |
| 2021 | $5,221 | $16,625 | $1,598 | $15,027 |
| 2020 | $5,099 | $16,625 | $1,598 | $15,027 |
| 2019 | $4,984 | $18,473 | $1,598 | $16,875 |
| 2018 | $3,848 | $15,450 | $1,398 | $14,052 |
| 2017 | $4,685 | $15,450 | $1,398 | $14,052 |
| 2016 | $4,372 | $15,450 | $1,398 | $14,052 |
| 2015 | $4,240 | $13,716 | $1,198 | $12,518 |
| 2014 | $3,325 | $13,716 | $1,198 | $12,518 |
| 2013 | $3,253 | $13,716 | $1,198 | $12,518 |
Source: Public Records
Map
Nearby Homes
- 8807 Dee Rd
- 8810 Briar Ct Unit 1B
- 8802 Briar Ct Unit 3A
- 1913 Rancho Ln
- 9342 Landings Ln Unit 504
- 9332 Landings Ln Unit 504
- 9377 Landings Ln Unit 507
- 9355 Landings Ln Unit 406
- 9395 Landings Ln Unit 405
- 9396 Landings Ln Unit 306
- 9396 Landings Ln Unit 202
- 9396 Landings Ln Unit 501
- 9396 Landings Ln Unit 504
- 9396 Landings Ln Unit 207
- 2000 Parkside Dr Unit FG
- 9208 Bumble Bee Dr Unit 2D
- 2818 Farrell Ave
- 1745 Pavilion Way Unit 502
- 1745 Pavilion Way Unit 206
- 1715 Pavilion Way Unit 206
- 8838 Robin Dr
- 8838 Robin Dr
- 8838 Robin Dr
- 8838 Robin Dr
- 8838 Robin Dr
- 8838 Robin Dr Unit F
- 8838 Robin Dr Unit C
- 8842 Robin Dr
- 8842 Robin Dr
- 8842 Robin Dr
- 8842 Robin Dr
- 8842 Robin Dr
- 8842 Robin Dr
- 8842 Robin Dr Unit E
- 8842 Robin Dr Unit A
- 8842 Robin Dr Unit C
- 8828 Robin Dr Unit D
- 8828 Robin Dr
- 8828 Robin Dr
- 8828 Robin Dr
Your Personal Tour Guide
Ask me questions while you tour the home.