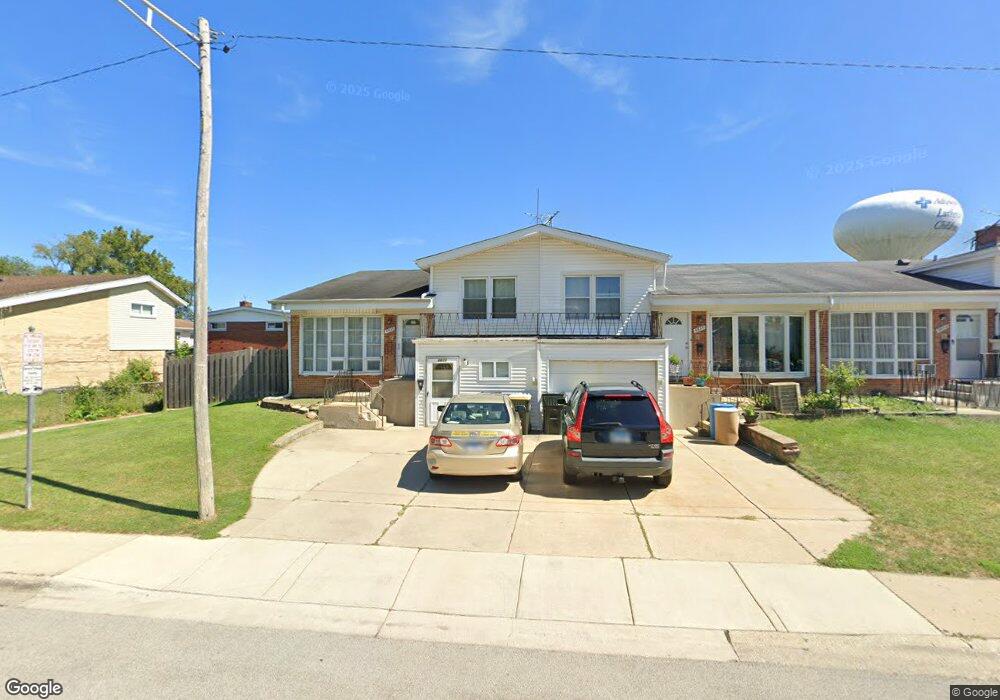
8839 Robin Dr Des Plaines, IL 60016
Estimated Value: $257,000 - $297,000
3
Beds
2
Baths
1,221
Sq Ft
$227/Sq Ft
Est. Value
About This Home
This home is located at 8839 Robin Dr, Des Plaines, IL 60016 and is currently estimated at $277,223, approximately $227 per square foot. 8839 Robin Dr is a home located in Cook County with nearby schools including Apollo Elementary School, Gemini Middle School, and Maine East High School.
Ownership History
Date
Name
Owned For
Owner Type
Purchase Details
Closed on
Aug 2, 2002
Sold by
Kogan Tanya
Bought by
Villegas Maria C
Current Estimated Value
Home Financials for this Owner
Home Financials are based on the most recent Mortgage that was taken out on this home.
Original Mortgage
$132,000
Outstanding Balance
$65,109
Interest Rate
9.37%
Mortgage Type
Unknown
Estimated Equity
$212,114
Purchase Details
Closed on
Feb 25, 1999
Sold by
Leanos Nancy and Arellano Nancy
Bought by
Kogan Tanya
Home Financials for this Owner
Home Financials are based on the most recent Mortgage that was taken out on this home.
Original Mortgage
$82,600
Interest Rate
6.83%
Mortgage Type
Stand Alone Second
Purchase Details
Closed on
Dec 30, 1993
Sold by
Arellano Luis M
Bought by
Arellano Nancy
Create a Home Valuation Report for This Property
The Home Valuation Report is an in-depth analysis detailing your home's value as well as a comparison with similar homes in the area
Home Values in the Area
Average Home Value in this Area
Purchase History
| Date | Buyer | Sale Price | Title Company |
|---|---|---|---|
| Villegas Maria C | $165,000 | -- | |
| Kogan Tanya | $118,000 | -- | |
| Arellano Nancy | -- | -- |
Source: Public Records
Mortgage History
| Date | Status | Borrower | Loan Amount |
|---|---|---|---|
| Open | Villegas Maria C | $132,000 | |
| Previous Owner | Kogan Tanya | $82,600 | |
| Closed | Kogan Tanya | $23,600 |
Source: Public Records
Tax History
| Year | Tax Paid | Tax Assessment Tax Assessment Total Assessment is a certain percentage of the fair market value that is determined by local assessors to be the total taxable value of land and additions on the property. | Land | Improvement |
|---|---|---|---|---|
| 2025 | $4,928 | $21,000 | $2,876 | $18,124 |
| 2024 | $4,928 | $21,500 | $3,500 | $18,000 |
| 2023 | $4,660 | $21,500 | $3,500 | $18,000 |
| 2022 | $4,660 | $21,500 | $3,500 | $18,000 |
| 2021 | $2,893 | $12,542 | $1,598 | $10,944 |
| 2020 | $2,895 | $12,542 | $1,598 | $10,944 |
| 2019 | $2,835 | $13,936 | $1,598 | $12,338 |
| 2018 | $3,376 | $14,414 | $1,398 | $13,016 |
| 2017 | $3,782 | $15,846 | $1,398 | $14,448 |
| 2016 | $3,778 | $15,846 | $1,398 | $14,448 |
| 2015 | $3,542 | $14,083 | $1,198 | $12,885 |
| 2014 | $3,435 | $14,083 | $1,198 | $12,885 |
| 2013 | $3,361 | $14,083 | $1,198 | $12,885 |
Source: Public Records
Map
Nearby Homes
- 8843 Robin Dr Unit C
- 8807 Dee Rd
- 8995 Kennedy Dr Unit 206F
- 9241 W Ballard Rd Unit 107
- 8810 Briar Ct Unit 1B
- 8802 Briar Ct Unit 3A
- 1710 Dempster St Unit A
- 1913 Rancho Ln
- 2000 Parkside Dr Unit FG
- 9332 Landings Ln Unit 604
- 9332 Landings Ln Unit 404
- 9332 Landings Ln Unit 504
- 8901 N Western Ave Unit A206
- 9396 Landings Ln Unit 306
- 9396 Landings Ln Unit 302
- 9396 Landings Ln Unit 202
- 9396 Landings Ln Unit 501
- 9396 Landings Ln Unit 201
- 9396 Landings Ln Unit 401
- 9396 Landings Ln Unit 207
- 8839 Robin Dr
- 8839 Robin Dr
- 8839 Robin Dr
- 8839 Robin Dr
- 8839 Robin Dr
- 8839 Robin Dr Unit A
- 8839 Robin Dr Unit B
- 8839 Robin Dr Unit E
- 8839 Robin Dr Unit F
- 8843 Robin Dr Unit D
- 8843 Robin Dr
- 8843 Robin Dr
- 8843 Robin Dr
- 8843 Robin Dr
- 8843 Robin Dr
- 8843 Robin Dr
- 8843 Robin Dr Unit F
- 8843 Robin Dr Unit A
- 8843 Robin Dr Unit E
- 8829 Robin Dr Unit A
Your Personal Tour Guide
Ask me questions while you tour the home.