Estimated Value: $340,390 - $370,000
3
Beds
2
Baths
2,453
Sq Ft
$145/Sq Ft
Est. Value
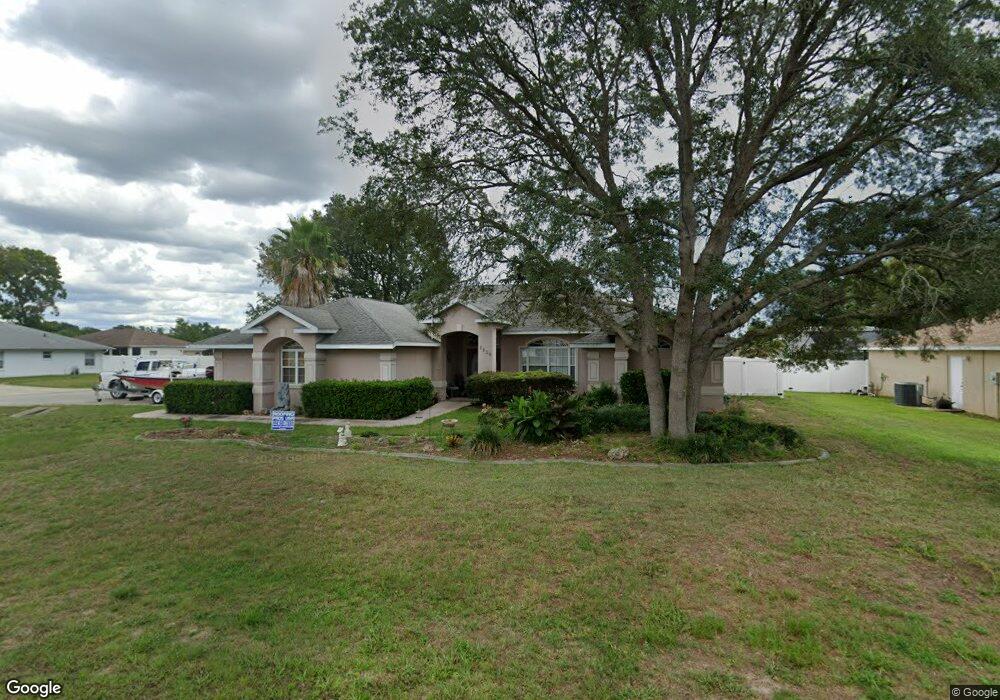
About This Home
This home is located at 8839 SW 57th Court Rd, Ocala, FL 34476 and is currently estimated at $356,098, approximately $145 per square foot. 8839 SW 57th Court Rd is a home located in Marion County with nearby schools including Hammett Bowen Jr. Elementary School, Liberty Middle School, and West Port High School.
Ownership History
Date
Name
Owned For
Owner Type
Purchase Details
Closed on
Jan 14, 2025
Sold by
Weaver Irene and King Irene
Bought by
Hamelers Rena
Current Estimated Value
Purchase Details
Closed on
Sep 10, 2004
Sold by
Pham Phillip and Pham Jennifer
Bought by
Weaver Irene
Purchase Details
Closed on
Jun 11, 2002
Sold by
Le Quoc E and Thi Lanh Nguyen
Bought by
Pham Phillip B and Pham Jennifer Le
Home Financials for this Owner
Home Financials are based on the most recent Mortgage that was taken out on this home.
Original Mortgage
$128,000
Interest Rate
6.23%
Purchase Details
Closed on
Nov 17, 2000
Sold by
Britt Gerald N
Bought by
Le Quoc E and Thi Lanh Nguyen
Home Financials for this Owner
Home Financials are based on the most recent Mortgage that was taken out on this home.
Original Mortgage
$154,800
Interest Rate
7.36%
Create a Home Valuation Report for This Property
The Home Valuation Report is an in-depth analysis detailing your home's value as well as a comparison with similar homes in the area
Home Values in the Area
Average Home Value in this Area
Purchase History
| Date | Buyer | Sale Price | Title Company |
|---|---|---|---|
| Hamelers Rena | $100 | None Listed On Document | |
| Hamelers Rena | $100 | None Listed On Document | |
| Weaver Irene | $195,000 | First American Title Ins Co | |
| Pham Phillip B | $182,000 | Titles Unlimited | |
| Le Quoc E | $172,000 | Security First Title Partner | |
| Britt Gerald N | -- | Security First Title Partner |
Source: Public Records
Mortgage History
| Date | Status | Borrower | Loan Amount |
|---|---|---|---|
| Previous Owner | Pham Phillip B | $128,000 | |
| Previous Owner | Le Quoc E | $154,800 |
Source: Public Records
Tax History Compared to Growth
Tax History
| Year | Tax Paid | Tax Assessment Tax Assessment Total Assessment is a certain percentage of the fair market value that is determined by local assessors to be the total taxable value of land and additions on the property. | Land | Improvement |
|---|---|---|---|---|
| 2024 | $4,838 | $280,623 | -- | -- |
| 2023 | $4,721 | $255,112 | $0 | $0 |
| 2022 | $4,330 | $231,920 | $0 | $0 |
| 2021 | $3,907 | $232,589 | $23,330 | $209,259 |
| 2020 | $3,467 | $191,669 | $21,000 | $170,669 |
| 2019 | $3,430 | $187,410 | $21,000 | $166,410 |
| 2018 | $3,341 | $191,154 | $17,000 | $174,154 |
| 2017 | $3,053 | $171,123 | $17,000 | $154,123 |
| 2016 | $2,932 | $162,660 | $0 | $0 |
| 2015 | $2,816 | $153,211 | $0 | $0 |
| 2014 | $2,627 | $149,530 | $0 | $0 |
Source: Public Records
Map
Nearby Homes
- 8871 SW 57th Court Rd
- 5920 SW 88th Place
- 5661 SW 88th Place
- 8895 SW 57th Ct
- 8671 SW 57th Court Rd
- 5659 SW 89th Place
- 5605 SW 89th St
- 13449 SW 60th Ave
- 8650 SW 55th Ct
- 5833 SW 85th Place
- 6125 SW 88th Loop
- 6197 SW 89th Street Rd
- 6209 SW 89th Street Rd
- 8636 SW 54th Ct
- 6233 SW 89th Street Rd
- 6243 SW 89th Street Rd
- 8483 SW 59th Terrace
- 8482 SW 59th Terrace
- 5392 SW 89th St
- 6175 SW 88th Loop
- 8845 SW 57th Court Rd
- 5785 SW 88th Place
- 8852 SW 56th Avenue Rd
- 8858 SW 56th Avenue Rd
- 5818 SW 88th Place
- 8800 SW 56th Avenue Rd
- 8834 SW 57th Court Rd
- 8789 SW 57th Court Rd
- 5830 SW 88th Place
- TBD SW 56 Avenue Rd
- 8780 SW 56th Avenue Rd
- 8859 SW 56th Avenue Rd
- 8788 SW 57th Court Rd
- 5825 SW 88th Place
- 5725 SW 88th Place
- 8853 SW 57th Court Rd
- 8870 SW 57th Court Rd
- 8770 SW 56th Avenue Rd
- 5856 SW 88th Place
- 8869 SW 56th Avenue Rd