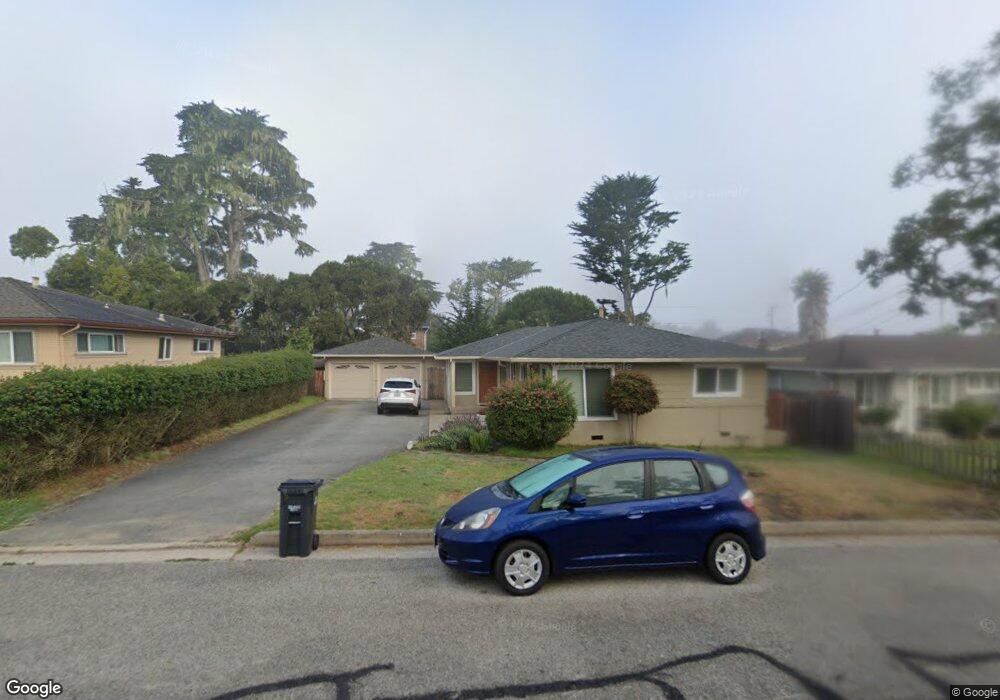
884 19th St Pacific Grove, CA 93950
Estimated Value: $1,384,000 - $1,480,944
4
Beds
2
Baths
1,492
Sq Ft
$960/Sq Ft
Est. Value
About This Home
This home is located at 884 19th St, Pacific Grove, CA 93950 and is currently estimated at $1,431,736, approximately $959 per square foot. 884 19th St is a home located in Monterey County with nearby schools including Forest Grove Elementary School, Pacific Grove Middle School, and Pacific Grove High School.
Ownership History
Date
Name
Owned For
Owner Type
Purchase Details
Closed on
Feb 23, 2010
Sold by
Fitzsimmons George W
Bought by
Pak Sung K and Pak Young S
Current Estimated Value
Home Financials for this Owner
Home Financials are based on the most recent Mortgage that was taken out on this home.
Original Mortgage
$350,000
Outstanding Balance
$231,641
Interest Rate
5.03%
Mortgage Type
New Conventional
Estimated Equity
$1,200,095
Purchase Details
Closed on
Nov 6, 2008
Sold by
Fitzsimmons Jeanette and Fitzsimmons George W
Bought by
Fitzsimmons Jeanette and Fitzsimmons George W
Create a Home Valuation Report for This Property
The Home Valuation Report is an in-depth analysis detailing your home's value as well as a comparison with similar homes in the area
Home Values in the Area
Average Home Value in this Area
Purchase History
We collect this data history from publicly available records. To have your information removed, we recommend requesting removal directly through your county’s website.
| Date | Buyer | Sale Price | Title Company |
|---|---|---|---|
| Pak Sung K | -- | Chicago Title Company | |
| Fitzsimmons Jeanette | -- | None Available |
Source: Public Records
Mortgage History
We collect this data history from publicly available records. To have your information removed, we recommend requesting removal directly through your county’s website.
| Date | Status | Borrower | Loan Amount |
|---|---|---|---|
| Open | Pak Sung K | $350,000 |
Source: Public Records
Tax History
| Year | Tax Paid | Tax Assessment Tax Assessment Total Assessment is a certain percentage of the fair market value that is determined by local assessors to be the total taxable value of land and additions on the property. | Land | Improvement |
|---|---|---|---|---|
| 2025 | $7,998 | $769,317 | $516,324 | $252,993 |
| 2024 | $7,998 | $754,233 | $506,200 | $248,033 |
| 2023 | $8,131 | $739,445 | $496,275 | $243,170 |
| 2022 | $7,966 | $724,947 | $486,545 | $238,402 |
| 2021 | $7,924 | $710,733 | $477,005 | $233,728 |
| 2020 | $7,765 | $703,446 | $472,114 | $231,332 |
| 2019 | $7,518 | $689,654 | $462,857 | $226,797 |
| 2018 | $7,368 | $676,132 | $453,782 | $222,350 |
| 2017 | $7,248 | $662,876 | $444,885 | $217,991 |
| 2016 | $7,264 | $649,879 | $436,162 | $213,717 |
| 2015 | $7,146 | $640,118 | $429,611 | $210,507 |
| 2014 | $6,439 | $627,580 | $421,196 | $206,384 |
Source: Public Records
Map
Nearby Homes
- 841 Congress Ave
- 843 Congress Ave
- 829 Congress Ave
- 902 19th St
- 902 19th St
- 906 19th St
- 847 Congress Ave
- 910 19th St
- 880 19th St
- 880 19th St
- 827 Congress Ave
- 851 Congress Ave
- 872 19th St
- 830 Congress Ave
- 718 Hillcrest Ave
- 714 Hillcrest Ave
- 722 Hillcrest Ave
- 706 Hillcrest Ave
- 700 Rosemont Ave
- 726 Hillcrest Ave
Your Personal Tour Guide
Ask me questions while you tour the home.