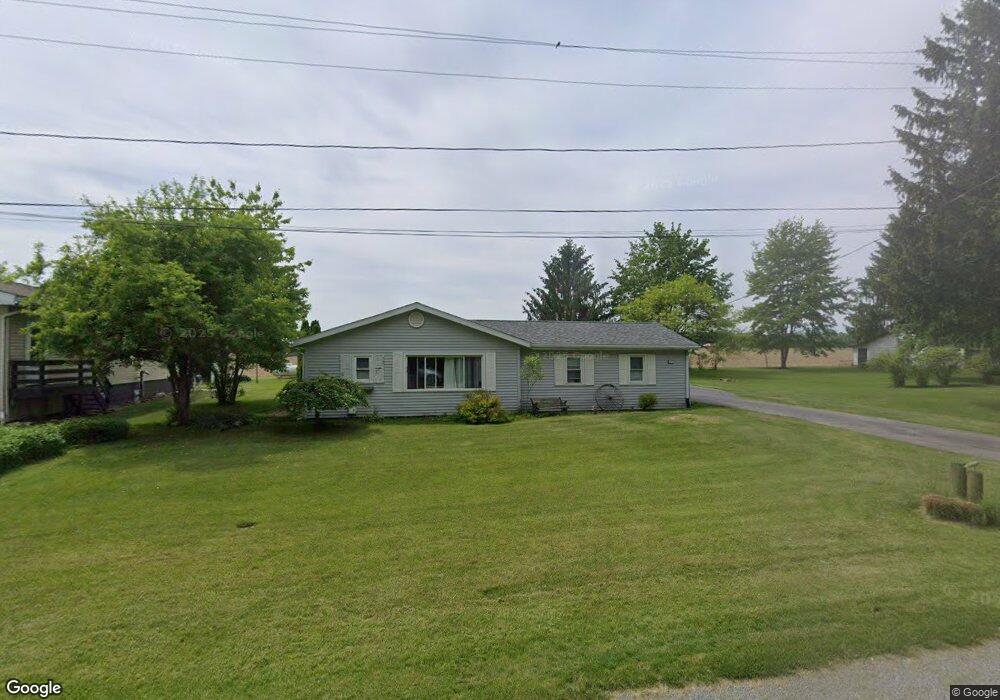
884 Long Shadow Ln Roaming Shores, OH 44085
Estimated Value: $171,000 - $254,000
2
Beds
2
Baths
1,683
Sq Ft
$129/Sq Ft
Est. Value
About This Home
This home is located at 884 Long Shadow Ln, Roaming Shores, OH 44085 and is currently estimated at $216,694, approximately $128 per square foot. 884 Long Shadow Ln is a home located in Ashtabula County with nearby schools including Grand Valley Elementary School, Grand Valley Middle School, and Grand Valley High School.
Ownership History
Date
Name
Owned For
Owner Type
Purchase Details
Closed on
Nov 4, 2022
Sold by
Pierce Randal M and Pierce Wanda E
Bought by
Pierce Jason Mack
Current Estimated Value
Home Financials for this Owner
Home Financials are based on the most recent Mortgage that was taken out on this home.
Original Mortgage
$138,200
Outstanding Balance
$120,748
Interest Rate
6.09%
Mortgage Type
New Conventional
Estimated Equity
$95,946
Purchase Details
Closed on
Feb 28, 2007
Sold by
Kinat Carol A and Kinat Kimberly A
Bought by
Pierce Randal M and Pierce Wanda E
Home Financials for this Owner
Home Financials are based on the most recent Mortgage that was taken out on this home.
Original Mortgage
$81,700
Interest Rate
6.27%
Mortgage Type
Purchase Money Mortgage
Create a Home Valuation Report for This Property
The Home Valuation Report is an in-depth analysis detailing your home's value as well as a comparison with similar homes in the area
Home Values in the Area
Average Home Value in this Area
Purchase History
| Date | Buyer | Sale Price | Title Company |
|---|---|---|---|
| Pierce Jason Mack | $200,000 | Title Professionals Group | |
| Pierce Randal M | $86,000 | Attorney |
Source: Public Records
Mortgage History
| Date | Status | Borrower | Loan Amount |
|---|---|---|---|
| Open | Pierce Jason Mack | $138,200 | |
| Previous Owner | Pierce Randal M | $81,700 |
Source: Public Records
Tax History Compared to Growth
Tax History
| Year | Tax Paid | Tax Assessment Tax Assessment Total Assessment is a certain percentage of the fair market value that is determined by local assessors to be the total taxable value of land and additions on the property. | Land | Improvement |
|---|---|---|---|---|
| 2024 | $3,297 | $41,300 | $7,280 | $34,020 |
| 2023 | $1,829 | $41,300 | $7,280 | $34,020 |
| 2022 | $1,715 | $33,950 | $5,600 | $28,350 |
| 2021 | $1,704 | $33,950 | $5,600 | $28,350 |
| 2020 | $1,193 | $33,950 | $5,600 | $28,350 |
| 2019 | $700 | $23,140 | $3,570 | $19,570 |
| 2018 | $687 | $23,140 | $3,570 | $19,570 |
| 2017 | $701 | $23,140 | $3,570 | $19,570 |
| 2016 | $720 | $23,140 | $3,570 | $19,570 |
| 2015 | $716 | $23,140 | $3,570 | $19,570 |
| 2014 | $697 | $23,140 | $3,570 | $19,570 |
| 2013 | $1,102 | $32,170 | $3,500 | $28,670 |
Source: Public Records
Map
Nearby Homes
- 986 Evening Star Dr
- 952 Lunar Ln
- 1437 Lake Vue Dr
- 1129 Lake Vue Dr
- 1497 Morning Star Dr
- 1315 Morning Star Dr
- 0 US Route 6 Unit 5161661
- 1749 Morning Star Dr
- 1629 Sugar Creek Dr
- 1250 Way Rd
- 1602 Pierpont Dr
- 1603 Pierpont Dr
- 748 Rome Rock Creek Rd
- 519 Rome Rock Creek Rd
- 62 Rockaway Dr
- 683 Rome Rock Creek Rd
- 5252 State Route 45
- 5174 Ohio 46
- 4772 Ohio 45
- 2018 Flame Lake Dr
- 883 Long Shadow Ln
- 882 Long Shadow Ln
- 886 Long Shadow Ln
- 922 Long Shadow Ln
- 974 Long Shadow Ln
- 960 Park Ln
- 888 Long Shadow Ln
- 980 Long Shadow Ln
- 957 Sunset Cir
- 889 Long Shadow Ln
- 972 Long Shadow Ln
- 962 Sunset Cir
- 968 Long Shadow Ln
- 981 Long Shadow Ln
- 878 Long Shadow Ln
- 971 Long Shadow Ln
- 963 Sunset Cir
- 913 Long Shadow Ln
- 966 Lunar Ln
- 964 Sunset Cir