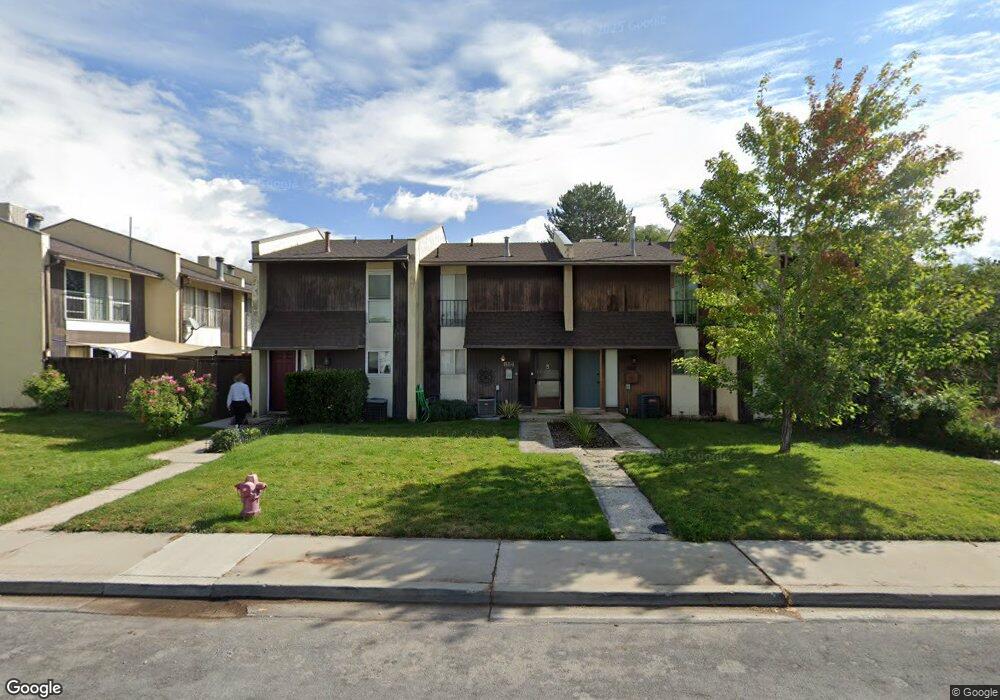
884 N 350 E Orem, UT 84057
Windsor NeighborhoodEstimated Value: $263,000 - $273,405
2
Beds
1
Bath
918
Sq Ft
$293/Sq Ft
Est. Value
About This Home
This home is located at 884 N 350 E, Orem, UT 84057 and is currently estimated at $268,802, approximately $292 per square foot. 884 N 350 E is a home located in Utah County with nearby schools including Orchard Elementary School, Canyon View Junior High School, and Timpanogos High School.
Ownership History
Date
Name
Owned For
Owner Type
Purchase Details
Closed on
Oct 22, 2021
Sold by
Smith Kimberlee K
Bought by
Smith Kimberly Kowallis and Smith Kevin Lawrence
Current Estimated Value
Home Financials for this Owner
Home Financials are based on the most recent Mortgage that was taken out on this home.
Original Mortgage
$108,000
Outstanding Balance
$82,992
Interest Rate
2.1%
Mortgage Type
New Conventional
Estimated Equity
$185,810
Purchase Details
Closed on
Mar 19, 2012
Sold by
Smith Kimberlee K
Bought by
Smith Kimberly K
Purchase Details
Closed on
Jan 3, 1997
Sold by
Shepherd Johnny D and Shepherd Chantel
Bought by
Panda Bear Homes Inc
Create a Home Valuation Report for This Property
The Home Valuation Report is an in-depth analysis detailing your home's value as well as a comparison with similar homes in the area
Home Values in the Area
Average Home Value in this Area
Purchase History
| Date | Buyer | Sale Price | Title Company |
|---|---|---|---|
| Smith Kimberly Kowallis | -- | Vanguard Title Ins Agcy | |
| Smith Kimberly K | -- | None Available | |
| Panda Bear Homes Inc | -- | -- |
Source: Public Records
Mortgage History
| Date | Status | Borrower | Loan Amount |
|---|---|---|---|
| Open | Smith Kimberly Kowallis | $108,000 |
Source: Public Records
Tax History
| Year | Tax Paid | Tax Assessment Tax Assessment Total Assessment is a certain percentage of the fair market value that is determined by local assessors to be the total taxable value of land and additions on the property. | Land | Improvement |
|---|---|---|---|---|
| 2025 | $1,057 | $129,690 | -- | -- |
| 2024 | $1,057 | $129,250 | $0 | $0 |
| 2023 | $982 | $129,030 | $0 | $0 |
| 2022 | $923 | $117,535 | $0 | $0 |
| 2021 | $869 | $167,600 | $20,100 | $147,500 |
| 2020 | $790 | $149,700 | $18,000 | $131,700 |
| 2019 | $730 | $143,900 | $16,500 | $127,400 |
| 2018 | $701 | $132,000 | $16,500 | $115,500 |
| 2017 | $654 | $65,945 | $0 | $0 |
| 2016 | $644 | $59,950 | $0 | $0 |
| 2015 | $594 | $52,250 | $0 | $0 |
| 2014 | $597 | $52,250 | $0 | $0 |
Source: Public Records
Map
Nearby Homes
Your Personal Tour Guide
Ask me questions while you tour the home.