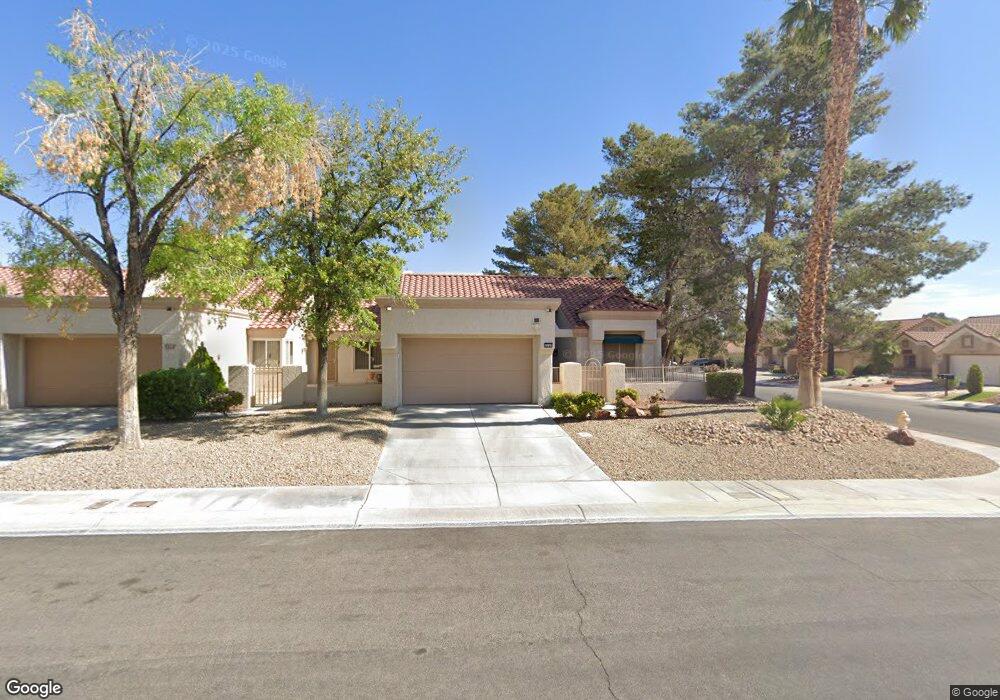
8840 Evening Star Dr Las Vegas, NV 89134
Sun City Summerlin NeighborhoodEstimated Value: $339,000 - $351,000
2
Beds
2
Baths
1,182
Sq Ft
$292/Sq Ft
Est. Value
About This Home
This home is located at 8840 Evening Star Dr, Las Vegas, NV 89134 and is currently estimated at $345,337, approximately $292 per square foot. 8840 Evening Star Dr is a home located in Clark County with nearby schools including William Lummis Elementary School, Ernest Becker Middle School, and Palo Verde High School.
Ownership History
Date
Name
Owned For
Owner Type
Purchase Details
Closed on
Jul 25, 2023
Sold by
Thompson Yuan Yuan
Bought by
Yyt Living Trust and Thompson
Current Estimated Value
Purchase Details
Closed on
Apr 10, 2008
Sold by
Enger Kenneth and Enger Kathy
Bought by
Thompson Yuan Yuan
Home Financials for this Owner
Home Financials are based on the most recent Mortgage that was taken out on this home.
Original Mortgage
$128,000
Interest Rate
5.99%
Mortgage Type
Unknown
Purchase Details
Closed on
Aug 13, 2007
Sold by
Enger Kathy
Bought by
Enger Kenneth and Enger Kathy
Purchase Details
Closed on
Oct 13, 1999
Sold by
Briggs Maxine D
Bought by
Briggs Maxine Dauu and The Maxine D Briggs Revocable Living Tr
Purchase Details
Closed on
Jun 24, 1994
Sold by
Demilt Florence A
Bought by
Briggs Maxine D
Home Financials for this Owner
Home Financials are based on the most recent Mortgage that was taken out on this home.
Original Mortgage
$94,400
Interest Rate
8.55%
Create a Home Valuation Report for This Property
The Home Valuation Report is an in-depth analysis detailing your home's value as well as a comparison with similar homes in the area
Home Values in the Area
Average Home Value in this Area
Purchase History
| Date | Buyer | Sale Price | Title Company |
|---|---|---|---|
| Yyt Living Trust | -- | None Listed On Document | |
| Thompson Yuan Yuan | $160,000 | First American Title Jones | |
| Enger Kenneth | -- | Accommodation | |
| Briggs Maxine Dauu | -- | -- | |
| Briggs Maxine D | $118,000 | Old Republic Title Company |
Source: Public Records
Mortgage History
| Date | Status | Borrower | Loan Amount |
|---|---|---|---|
| Previous Owner | Thompson Yuan Yuan | $128,000 | |
| Previous Owner | Briggs Maxine D | $94,400 |
Source: Public Records
Tax History Compared to Growth
Tax History
| Year | Tax Paid | Tax Assessment Tax Assessment Total Assessment is a certain percentage of the fair market value that is determined by local assessors to be the total taxable value of land and additions on the property. | Land | Improvement |
|---|---|---|---|---|
| 2025 | $1,408 | $70,396 | $32,550 | $37,846 |
| 2024 | $1,423 | $70,396 | $32,550 | $37,846 |
| 2023 | $1,423 | $63,975 | $28,700 | $35,275 |
| 2022 | $1,381 | $57,526 | $23,800 | $33,726 |
| 2021 | $1,341 | $50,176 | $22,050 | $28,126 |
| 2020 | $1,299 | $51,196 | $21,700 | $29,496 |
| 2019 | $1,261 | $48,739 | $19,250 | $29,489 |
| 2018 | $1,225 | $45,477 | $16,975 | $28,502 |
| 2017 | $1,381 | $41,277 | $13,475 | $27,802 |
| 2016 | $1,161 | $39,472 | $10,850 | $28,622 |
| 2015 | $1,157 | $36,990 | $8,750 | $28,240 |
| 2014 | $1,123 | $34,697 | $8,400 | $26,297 |
Source: Public Records
Map
Nearby Homes
- 8904 Evening Star Dr
- 8845 Sunny Mead Ct
- 2652 Golfside Dr
- 8844 Sunny Mead Ct
- 8909 Meadowood Dr
- 2725 Showcase Dr
- 2633 Legend Dr
- 2900 Golfside Dr
- 2553 Showcase Dr
- 2824 Crown Ridge Dr
- 8701 Millsboro Dr
- 2900 Crown Ridge Dr
- 8628 Desert Holly Dr
- 9024 Starmount Dr
- 9061 Gemstone Dr
- 9048 Starmount Dr
- 2528 Sunup Dr
- 8925 Litchfield Ave
- 2836 Linkview Dr
- 8901 Litchfield Ave
- 8844 Evening Star Dr
- 8848 Evening Star Dr
- 8852 Evening Star Dr
- 2704 Golfside Dr
- 8849 Sunny Mead Ct
- 2708 Golfside Dr
- 8845 Evening Star Dr
- 2700 Golfside Dr
- 8856 Evening Star Dr
- 2712 Golfside Dr Unit 8
- 2656 Golfside Dr
- 8849 Evening Star Dr
- 8860 Evening Star Dr
- 2716 Golfside Dr
- 8852 Sunny Mead Ct
- 8900 Evening Star Dr
- 8844 Meadowood Dr
- 8901 Evening Star Dr
- 8848 Meadowood Dr
- 2720 Golfside Dr