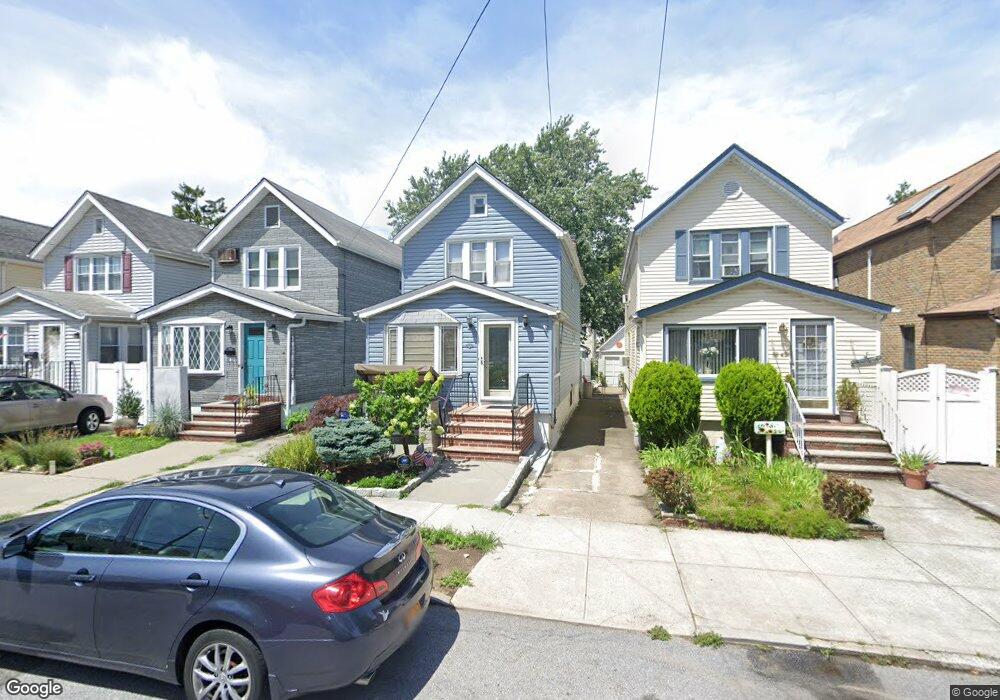
8841 69th Rd Forest Hills, NY 11375
Forest Hills NeighborhoodEstimated Value: $855,833 - $973,000
--
Bed
--
Bath
1,248
Sq Ft
$728/Sq Ft
Est. Value
About This Home
This home is located at 8841 69th Rd, Forest Hills, NY 11375 and is currently estimated at $908,958, approximately $728 per square foot. 8841 69th Rd is a home located in Queens County with nearby schools including Ps 144 Col Jeromus Remsen, J.H.S. 190 Russell Sage, and Queens Metropolitan High School.
Ownership History
Date
Name
Owned For
Owner Type
Purchase Details
Closed on
Aug 10, 2006
Sold by
Montenegro Melanie and Rogers Sherri
Bought by
Tirona Camille and Tirona Juan
Current Estimated Value
Home Financials for this Owner
Home Financials are based on the most recent Mortgage that was taken out on this home.
Original Mortgage
$504,000
Outstanding Balance
$303,743
Interest Rate
6.83%
Mortgage Type
Purchase Money Mortgage
Estimated Equity
$605,215
Purchase Details
Closed on
Feb 13, 2001
Sold by
Nivelli Mickey and Kumar Chand
Bought by
Montenegro Melanie M and Rogers Sherri M
Home Financials for this Owner
Home Financials are based on the most recent Mortgage that was taken out on this home.
Original Mortgage
$270,750
Interest Rate
7.15%
Purchase Details
Closed on
Jun 9, 1998
Sold by
Chami Enterprises Inc
Bought by
Nivelli Mickey and Kumar Chand
Create a Home Valuation Report for This Property
The Home Valuation Report is an in-depth analysis detailing your home's value as well as a comparison with similar homes in the area
Home Values in the Area
Average Home Value in this Area
Purchase History
| Date | Buyer | Sale Price | Title Company |
|---|---|---|---|
| Tirona Camille | $630,000 | -- | |
| Montenegro Melanie M | $285,000 | Fidelity National Title Ins | |
| Nivelli Mickey | -- | -- |
Source: Public Records
Mortgage History
| Date | Status | Borrower | Loan Amount |
|---|---|---|---|
| Open | Tirona Camille | $504,000 | |
| Previous Owner | Montenegro Melanie M | $270,750 |
Source: Public Records
Tax History Compared to Growth
Tax History
| Year | Tax Paid | Tax Assessment Tax Assessment Total Assessment is a certain percentage of the fair market value that is determined by local assessors to be the total taxable value of land and additions on the property. | Land | Improvement |
|---|---|---|---|---|
| 2025 | $6,030 | $35,576 | $8,431 | $27,145 |
| 2024 | $6,030 | $34,824 | $9,125 | $25,699 |
| 2023 | $5,685 | $33,106 | $8,789 | $24,317 |
| 2022 | $5,307 | $47,760 | $13,380 | $34,380 |
| 2021 | $5,233 | $51,060 | $13,380 | $37,680 |
| 2020 | $5,259 | $47,160 | $13,380 | $33,780 |
| 2019 | $5,067 | $49,260 | $13,380 | $35,880 |
| 2018 | $4,348 | $27,588 | $8,776 | $18,812 |
| 2017 | $4,475 | $26,154 | $7,535 | $18,619 |
| 2016 | $4,110 | $26,154 | $7,535 | $18,619 |
| 2015 | $2,486 | $24,706 | $9,819 | $14,887 |
| 2014 | $2,486 | $24,184 | $10,691 | $13,493 |
Source: Public Records
Map
Nearby Homes
- 90-15 70th Dr
- 100-33 Metropolitan Ave
- 9010 70th Dr
- 8810 70th Rd
- 91-35 71st Ave
- 92-11 70th Ave
- 68-15 Selfridge Stre 68-15 Selfridge St Unit 5G
- 88-03 70th Dr
- 68-15 Selfridge St Unit 3J
- 68-15 Selfridge St Unit 5D
- 68-15 Selfridge St Unit 1J
- 68-40 Manse St
- 68-20 Selfridge St Unit 6H
- 68-20 Selfridge St Unit 6J
- 91-48 71st Ave
- 70-19 Manse St
- 90-60 Union Turnpike Unit 9E
- 69-01 Alderton St
- 6915 Loubet St
- 6897 Alderton St