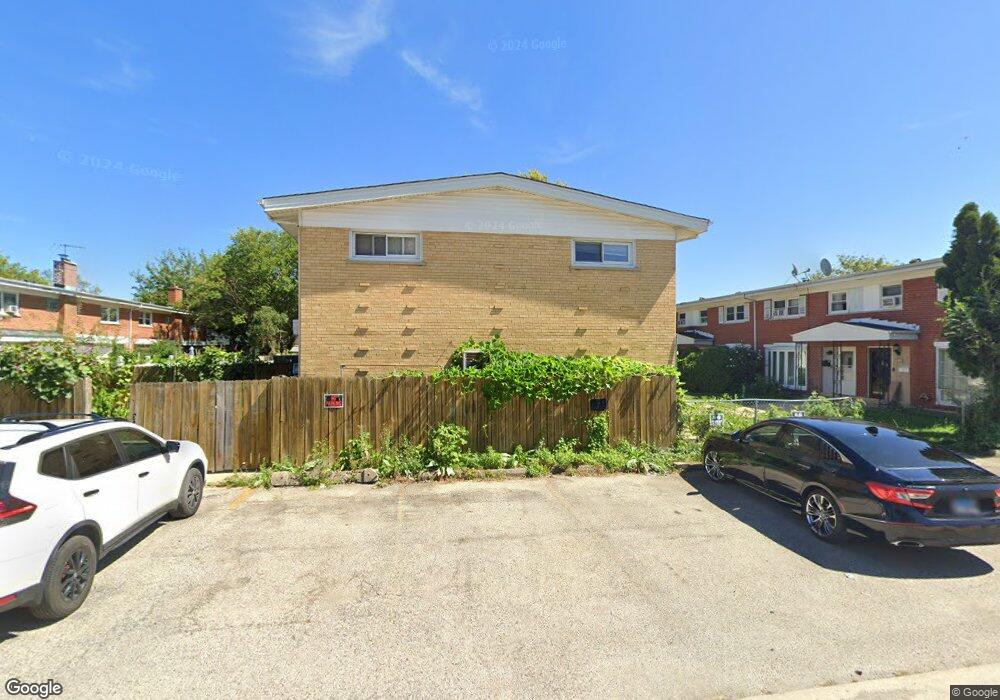
8842 Robin Dr Des Plaines, IL 60016
Estimated Value: $254,000 - $288,000
3
Beds
2
Baths
1,223
Sq Ft
$221/Sq Ft
Est. Value
About This Home
This home is located at 8842 Robin Dr, Des Plaines, IL 60016 and is currently estimated at $270,272, approximately $220 per square foot. 8842 Robin Dr is a home located in Cook County with nearby schools including Apollo Elementary School, Gemini Middle School, and Maine East High School.
Ownership History
Date
Name
Owned For
Owner Type
Purchase Details
Closed on
Feb 27, 2008
Sold by
Deutsche Bank National Trust Co
Bought by
Anwer Mohammad S and Sohail Nasreen
Current Estimated Value
Home Financials for this Owner
Home Financials are based on the most recent Mortgage that was taken out on this home.
Original Mortgage
$136,000
Outstanding Balance
$86,350
Interest Rate
6.1%
Mortgage Type
Unknown
Estimated Equity
$183,922
Purchase Details
Closed on
Nov 13, 2007
Sold by
Best Merva
Bought by
Deutsche Bank National Trust Co and Long Beach Mortgage Loan Trust 2004-1 As
Purchase Details
Closed on
Aug 25, 2003
Sold by
Dhorchowdhury Ranit K
Bought by
Best Merva and Yorke Chester A
Home Financials for this Owner
Home Financials are based on the most recent Mortgage that was taken out on this home.
Original Mortgage
$163,200
Interest Rate
9.85%
Mortgage Type
Unknown
Create a Home Valuation Report for This Property
The Home Valuation Report is an in-depth analysis detailing your home's value as well as a comparison with similar homes in the area
Home Values in the Area
Average Home Value in this Area
Purchase History
| Date | Buyer | Sale Price | Title Company |
|---|---|---|---|
| Anwer Mohammad S | $165,000 | First American Title | |
| Deutsche Bank National Trust Co | -- | None Available | |
| Best Merva | -- | Multiple |
Source: Public Records
Mortgage History
| Date | Status | Borrower | Loan Amount |
|---|---|---|---|
| Open | Anwer Mohammad S | $136,000 | |
| Previous Owner | Best Merva | $163,200 |
Source: Public Records
Tax History Compared to Growth
Tax History
| Year | Tax Paid | Tax Assessment Tax Assessment Total Assessment is a certain percentage of the fair market value that is determined by local assessors to be the total taxable value of land and additions on the property. | Land | Improvement |
|---|---|---|---|---|
| 2024 | $1,773 | $21,500 | $3,500 | $18,000 |
| 2023 | $1,740 | $21,500 | $3,500 | $18,000 |
| 2022 | $1,740 | $21,500 | $3,500 | $18,000 |
| 2021 | $1,855 | $12,567 | $2,001 | $10,566 |
| 2020 | $1,951 | $12,567 | $2,001 | $10,566 |
| 2019 | $1,917 | $13,964 | $2,001 | $11,963 |
| 2018 | $3,562 | $15,020 | $1,750 | $13,270 |
| 2017 | $3,531 | $15,020 | $1,750 | $13,270 |
| 2016 | $3,544 | $15,020 | $1,750 | $13,270 |
| 2015 | $3,320 | $13,363 | $1,500 | $11,863 |
| 2014 | $3,628 | $14,730 | $1,500 | $13,230 |
| 2013 | $3,551 | $14,730 | $1,500 | $13,230 |
Source: Public Records
Map
Nearby Homes
- 8807 Dee Rd
- 8999 Kennedy Dr Unit 1B
- 8810 Briar Ct Unit 1B
- 8808 Briar Ct Unit 88082A
- 9332 Landings Ln Unit 504
- 9356 Landings Ln Unit 505
- 9355 Landings Ln Unit 406
- 1710 Dempster St Unit C
- 9375 Landings Ln Unit 407
- 9396 Landings Ln Unit 203
- 9396 Landings Ln Unit 301
- 9396 Landings Ln Unit 506
- 9396 Landings Ln Unit 207
- 9396 Landings Ln Unit 404
- 9396 Landings Ln Unit 605
- 9231 Aspen Ln
- 8974 N Western Ave Unit D409
- 9209 Potter Rd Unit 2F
- 9153 W Oaks Ave
- 1500 Davis St
- 8842 Robin Dr
- 8842 Robin Dr
- 8842 Robin Dr
- 8842 Robin Dr
- 8842 Robin Dr
- 8842 Robin Dr Unit E
- 8842 Robin Dr Unit A
- 8842 Robin Dr Unit C
- 8838 Robin Dr
- 8838 Robin Dr
- 8838 Robin Dr
- 8838 Robin Dr
- 8838 Robin Dr
- 8838 Robin Dr
- 8838 Robin Dr Unit F
- 8838 Robin Dr Unit C
- 8852 Robin Dr
- 8852 Robin Dr
- 8852 Robin Dr
- 8852 Robin Dr