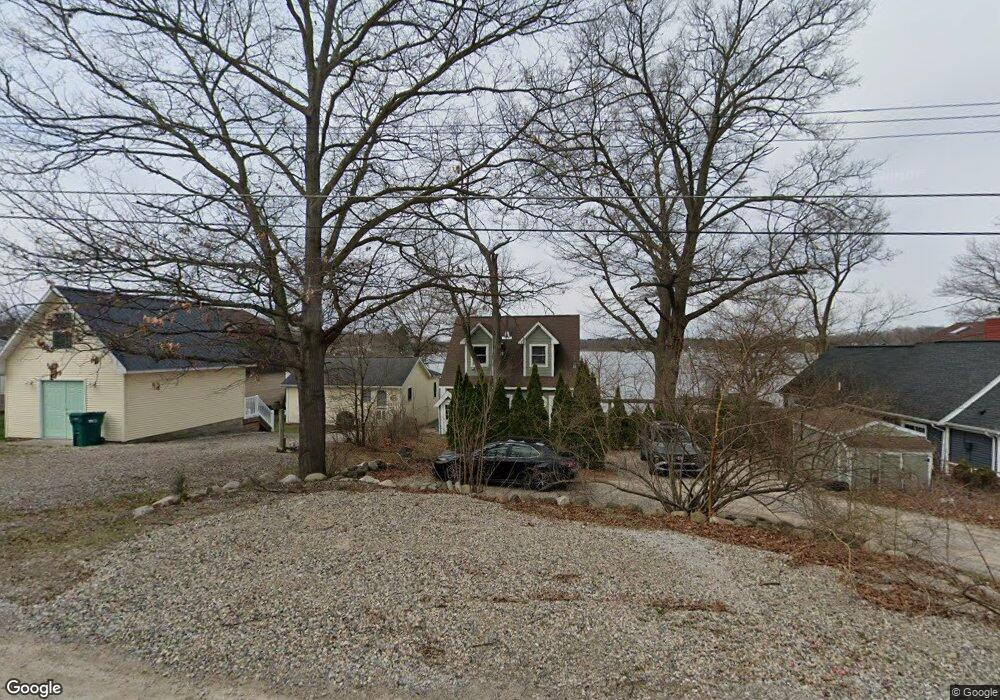
8842 Rushside Dr Pinckney, MI 48169
Estimated Value: $298,000 - $414,000
4
Beds
1
Bath
728
Sq Ft
$463/Sq Ft
Est. Value
About This Home
This home is located at 8842 Rushside Dr, Pinckney, MI 48169 and is currently estimated at $337,251, approximately $463 per square foot. 8842 Rushside Dr is a home located in Livingston County with nearby schools including Country Elementary School, Navigator School, and Pathfinder School.
Ownership History
Date
Name
Owned For
Owner Type
Purchase Details
Closed on
Apr 11, 2018
Sold by
Hardy Keith L and Hardy Mikelle L
Bought by
Hardy Keith L and Hardy Mikelle L
Current Estimated Value
Purchase Details
Closed on
Aug 9, 2017
Sold by
Earthorne Mikelle L
Bought by
Hardy Keith L and Hardy Mikelle L
Home Financials for this Owner
Home Financials are based on the most recent Mortgage that was taken out on this home.
Interest Rate
3.92%
Purchase Details
Closed on
Jul 28, 2017
Sold by
Rhodes Charles R
Bought by
Coleman John L
Home Financials for this Owner
Home Financials are based on the most recent Mortgage that was taken out on this home.
Interest Rate
3.92%
Purchase Details
Closed on
Jun 7, 2004
Sold by
Coleman John L
Bought by
Coleman John L and Eathorne Mikelle L
Purchase Details
Closed on
Aug 22, 1980
Sold by
Coleman Louise M
Bought by
Coleman John L
Create a Home Valuation Report for This Property
The Home Valuation Report is an in-depth analysis detailing your home's value as well as a comparison with similar homes in the area
Home Values in the Area
Average Home Value in this Area
Purchase History
| Date | Buyer | Sale Price | Title Company |
|---|---|---|---|
| Hardy Keith L | -- | -- | |
| Hardy Keith L | -- | Select Title | |
| Coleman John L | $26,000 | -- | |
| Coleman John L | -- | -- | |
| Coleman John L | -- | American Title Ins Co |
Source: Public Records
Mortgage History
| Date | Status | Borrower | Loan Amount |
|---|---|---|---|
| Previous Owner | Coleman John L | -- |
Source: Public Records
Tax History
| Year | Tax Paid | Tax Assessment Tax Assessment Total Assessment is a certain percentage of the fair market value that is determined by local assessors to be the total taxable value of land and additions on the property. | Land | Improvement |
|---|---|---|---|---|
| 2025 | $713 | $174,470 | $0 | $0 |
| 2024 | $693 | $140,030 | $0 | $0 |
| 2023 | $661 | $125,060 | $0 | $0 |
| 2022 | $2,021 | $102,850 | $0 | $0 |
| 2021 | $2,617 | $102,850 | $0 | $0 |
| 2020 | $2,626 | $98,900 | $0 | $0 |
| 2019 | $2,624 | $96,650 | $0 | $0 |
| 2018 | $2,626 | $92,340 | $0 | $0 |
| 2017 | $2,556 | $92,340 | $0 | $0 |
| 2016 | $2,570 | $100,270 | $0 | $0 |
| 2014 | $2,605 | $97,190 | $0 | $0 |
| 2012 | $2,605 | $96,590 | $0 | $0 |
Source: Public Records
Map
Nearby Homes
- 3391 Orchard
- 8645 Country Club Dr
- 0000 Van Horn
- 8625 Creston Dr
- 3333 Junior Dr
- 3174 Nisbet Rd
- 8431 Baudine Rd
- 8292 Pettysville Rd
- 3450 Hooker Rd
- 3172 Shadow Brook Ln
- 3020 Michigan 36
- 9560 Bluewater Dr
- 2456 Spartans Trail Unit 84
- 3590 Habitat Trail Unit 25
- 3778 Ponchartrain Dr
- 000 Swarthout Rd
- 3821 Langley Dr
- 2500 Whispering Pines Dr
- 3822 Langley Dr
- 9641 Rolling Greens Dr
- 8822 Rushside Dr
- 8850 Rushside Dr
- 8814 Rushside Dr
- 8860 Rushside Dr
- 8806 Rushside Dr
- 0 Rushside Dr
- 8882 Rushside Dr
- 8788 Rushside Dr
- 8892 Rushside Dr
- 8855 Rushside Dr
- 8867 Rushside Dr
- 8817 Rushside Dr
- 8778 Rushside Dr
- 8880 Rushview Dr
- 8873 Rushside Dr
- 8772 Rushside Dr
- 8883 Rushside Dr
- 8766 Rushside Dr
- 8932 Rushside Dr
- 8886 Rushview Dr
Your Personal Tour Guide
Ask me questions while you tour the home.