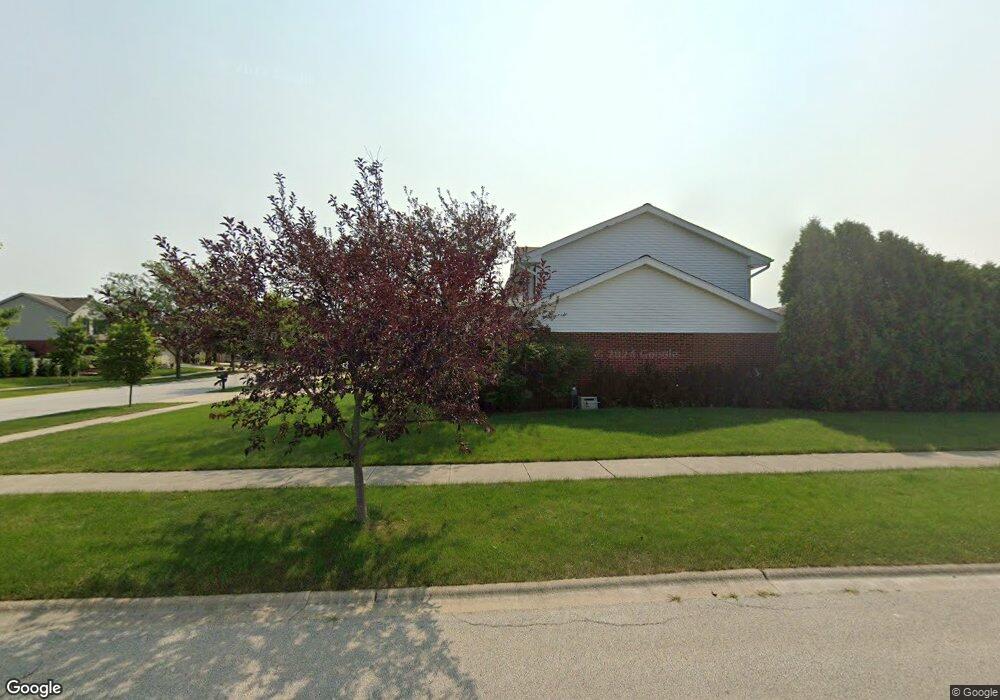
8843 Clifton Ln Tinley Park, IL 60487
Central Tinley Park NeighborhoodEstimated Value: $547,157 - $582,000
4
Beds
3
Baths
2,716
Sq Ft
$209/Sq Ft
Est. Value
About This Home
This home is located at 8843 Clifton Ln, Tinley Park, IL 60487 and is currently estimated at $567,039, approximately $208 per square foot. 8843 Clifton Ln is a home located in Cook County with nearby schools including Millennium Elementary School, Prairie View Middle School, and Victor J Andrew High School.
Ownership History
Date
Name
Owned For
Owner Type
Purchase Details
Closed on
Jan 28, 2002
Sold by
Standard Bank & Trust Company
Bought by
Korn Joseph A and Korn Edith
Current Estimated Value
Home Financials for this Owner
Home Financials are based on the most recent Mortgage that was taken out on this home.
Original Mortgage
$225,000
Outstanding Balance
$92,114
Interest Rate
6.92%
Estimated Equity
$474,925
Create a Home Valuation Report for This Property
The Home Valuation Report is an in-depth analysis detailing your home's value as well as a comparison with similar homes in the area
Home Values in the Area
Average Home Value in this Area
Purchase History
| Date | Buyer | Sale Price | Title Company |
|---|---|---|---|
| Korn Joseph A | $289,500 | -- |
Source: Public Records
Mortgage History
| Date | Status | Borrower | Loan Amount |
|---|---|---|---|
| Open | Korn Joseph A | $225,000 |
Source: Public Records
Tax History Compared to Growth
Tax History
| Year | Tax Paid | Tax Assessment Tax Assessment Total Assessment is a certain percentage of the fair market value that is determined by local assessors to be the total taxable value of land and additions on the property. | Land | Improvement |
|---|---|---|---|---|
| 2024 | $11,851 | $42,429 | $6,741 | $35,688 |
| 2023 | $10,137 | $46,000 | $6,741 | $39,259 |
| 2022 | $10,137 | $31,854 | $5,862 | $25,992 |
| 2021 | $9,842 | $31,854 | $5,862 | $25,992 |
| 2020 | $9,663 | $31,854 | $5,862 | $25,992 |
| 2019 | $10,360 | $35,373 | $5,275 | $30,098 |
| 2018 | $10,136 | $35,373 | $5,275 | $30,098 |
| 2017 | $9,885 | $35,373 | $5,275 | $30,098 |
| 2016 | $9,915 | $32,350 | $4,689 | $27,661 |
| 2015 | $9,767 | $32,350 | $4,689 | $27,661 |
| 2014 | $9,701 | $32,350 | $4,689 | $27,661 |
| 2013 | $9,814 | $35,126 | $4,689 | $30,437 |
Source: Public Records
Map
Nearby Homes
- 17631 Dover Ct
- Fremont Plan at Radcliffe Place
- Calysta Plan at Radcliffe Place
- Danbury Plan at Radcliffe Place
- Briarcliffe Plan at Radcliffe Place
- Eden Plan at Radcliffe Place
- Amberwood Plan at Radcliffe Place
- 17533 Pecan Ln
- 9201 175th St
- 9280 Windsor Pkwy Unit 92
- 9260 Windsor Pkwy Unit 80
- 17324 Humber Ln
- 17964 Upland Dr
- 17230 Shetland Dr
- 18055 Upland Dr
- 9038 Mansfield Dr Unit 8
- 8543 Carriage Ln
- 9051 Mansfield Dr Unit 1
- 8313 Aster Ln
- 8416 Stratford Dr Unit 8416
- 8830 178th St
- 8824 178th St Unit 2
- 17701 Woburn Rd
- 8831 Clifton Ln
- 17718 Woburn Rd
- 17712 Woburn Rd
- 8818 178th St
- 17706 Woburn Rd
- 17724 Woburn Rd
- 8836 Clifton Ln
- 17631 Woburn Rd
- 8825 Clifton Ln
- 8812 178th St
- 8830 Clifton Ln
- 17700 Woburn Rd
- 8910 178th St
- 8827 178th St
- 8821 178th St
- 17625 Woburn Rd
- 17641 Princess Elizabeth Ct