Estimated Value: $741,000 - $914,000
3
Beds
3
Baths
2,678
Sq Ft
$309/Sq Ft
Est. Value
About This Home
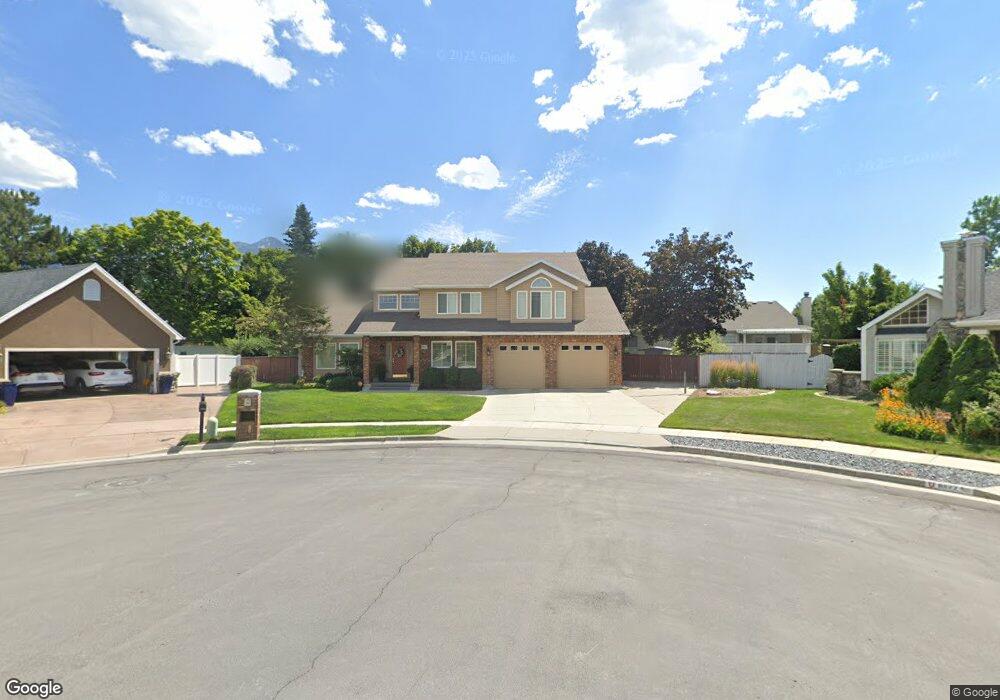
This home is located at 8843 Crest Point Cir, Sandy, UT 84093 and is currently estimated at $827,247, approximately $308 per square foot. 8843 Crest Point Cir is a home located in Salt Lake County with nearby schools including Quail Hollow Elementary School, Albion Middle School, and Brighton High School.
Ownership History
Date
Name
Owned For
Owner Type
Purchase Details
Closed on
Feb 21, 2023
Sold by
Mason Clint T
Bought by
Clint T Mason And Pauline A Mason Family Trus
Current Estimated Value
Create a Home Valuation Report for This Property
The Home Valuation Report is an in-depth analysis detailing your home's value as well as a comparison with similar homes in the area
Home Values in the Area
Average Home Value in this Area
Purchase History
| Date | Buyer | Sale Price | Title Company |
|---|---|---|---|
| Clint T Mason And Pauline A Mason Family Trus | -- | -- |
Source: Public Records
Tax History Compared to Growth
Tax History
| Year | Tax Paid | Tax Assessment Tax Assessment Total Assessment is a certain percentage of the fair market value that is determined by local assessors to be the total taxable value of land and additions on the property. | Land | Improvement |
|---|---|---|---|---|
| 2025 | $4,148 | $789,100 | $312,400 | $476,700 |
| 2024 | $4,148 | $777,500 | $300,800 | $476,700 |
| 2023 | $3,514 | $657,500 | $289,200 | $368,300 |
| 2022 | $3,550 | $653,500 | $283,600 | $369,900 |
| 2021 | $3,308 | $518,400 | $250,700 | $267,700 |
| 2020 | $3,284 | $485,600 | $241,100 | $244,500 |
| 2019 | $3,093 | $446,200 | $227,500 | $218,700 |
| 2018 | $2,896 | $437,000 | $227,500 | $209,500 |
| 2017 | $2,809 | $405,400 | $227,500 | $177,900 |
| 2016 | $2,724 | $380,100 | $205,000 | $175,100 |
| 2015 | -- | $348,400 | $211,100 | $137,300 |
| 2014 | $2,669 | $339,100 | $211,100 | $128,000 |
Source: Public Records
Map
Nearby Homes
- 2311 Snow Mountain Dr
- 2167 E Alta Cove Cir
- 2120 E Newcastle Dr
- 8965 Quail Run Dr
- 9034 Cheshire Cir
- 9123 Meadow Ct
- 8571 Monitor Dr
- 2056 E Meadow Lark Way
- 2271 E Alta Canyon Dr
- 2509 E Cobblestone Way
- 2131 Gad Way
- 9061 S Newcastle Cir
- 2650 Willow Wick Dr
- 2646 Snow Mountain Dr
- 1924 E Viscounti Cove
- 8483 S Terrace Dr
- 1990 E Terra Vista Way
- 9293 S Quail Run Dr
- 2360 Woodchuck Way
- 2043 E Brady Creek Cir
- 8835 Crest Point Cir
- 2265 Willow Hills Dr
- 2265 E Willow Hills Dr
- 2255 Willow Hills Dr
- 2255 E Willow Hills Dr
- 8842 Crest Point Cir
- 8842 S Crest Point Cir
- 8846 S Renegade Rd
- 8846 Renegade Rd
- 8825 Crest Point Cir
- 8836 Renegade Rd
- 8836 S Renegade Rd
- 8832 Crest Point Cir
- 2275 Willow Hills Dr
- 2275 E Willow Hills Dr
- 2247 Willow Hills Dr
- 8822 Crest Point Cir
- 8822 S Crest Point Cir
- 8828 Renegade Rd
- 2237 Willow Hills Dr