Estimated Value: $389,000 - $473,000
About This Home
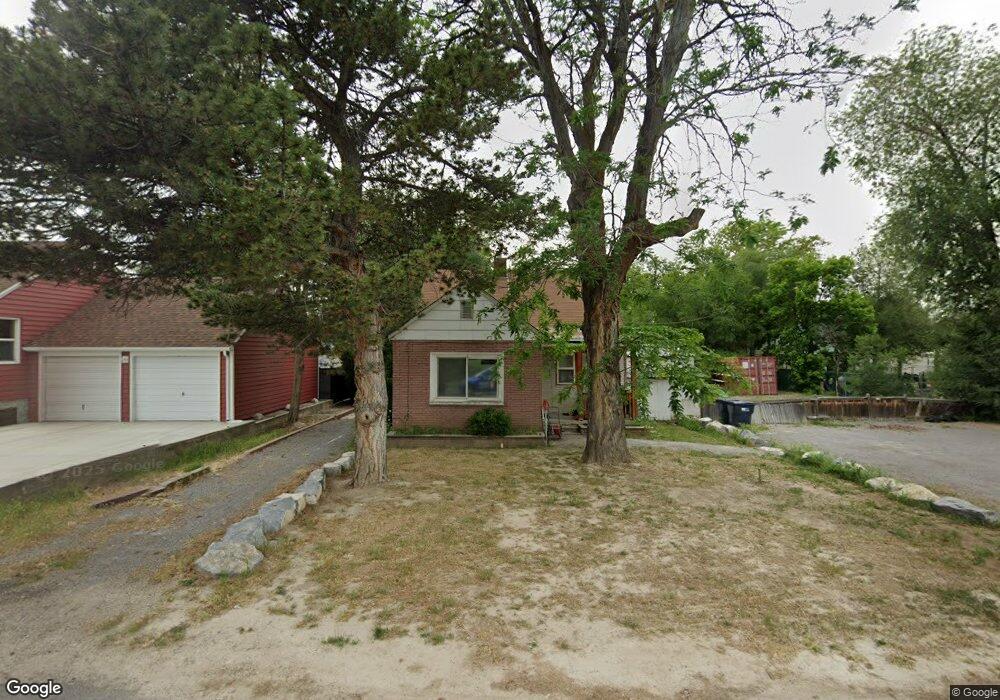
This home is located at 8846 S 580 E, Sandy, UT 84070 and is currently estimated at $437,064, approximately $322 per square foot. 8846 S 580 E is a home located in Salt Lake County with nearby schools including Sandy Elementary School, Mount Jordan Middle School, and Jordan High.
Ownership History
We collect this data history from publicly available records. To have your information removed, we recommend requesting removal directly through your county’s website.
Purchase Details
Purchase Details
Home Financials for this Owner
Home Financials are based on the most recent Mortgage that was taken out on this home.Purchase Details
Home Financials for this Owner
Home Financials are based on the most recent Mortgage that was taken out on this home.Purchase Details
Home Financials for this Owner
Home Financials are based on the most recent Mortgage that was taken out on this home.Home Values in the Area
Average Home Value in this Area
Purchase History
We collect this data history from publicly available records. To have your information removed, we recommend requesting removal directly through your county’s website.
| Date | Buyer | Sale Price | Title Company |
|---|---|---|---|
| -- | Titan Title Ins Agcy Inc | ||
| -- | Sutherland Title | ||
| -- | Sutherland Title Company | ||
| -- | Superior Title Company | ||
| -- | -- | ||
| -- | -- |
Mortgage History
We collect this data history from publicly available records. To have your information removed, we recommend requesting removal directly through your county’s website.
| Date | Status | Borrower | Loan Amount |
|---|---|---|---|
| Open | $104,904 | ||
| Closed | $104,904 | ||
| Closed | $105,346 | ||
| Previous Owner | $75,000 | ||
| Previous Owner | $81,000 |
Tax History
We collect this data history from publicly available records. To have your information removed, we recommend requesting removal directly through your county’s website.
| Year | Tax Paid | Tax Assessment Tax Assessment Total Assessment is a certain percentage of the fair market value that is determined by local assessors to be the total taxable value of land and additions on the property. | Land | Improvement |
|---|---|---|---|---|
| 2025 | $1,990 | $374,200 | $133,800 | $240,400 |
| 2024 | $1,629 | $301,300 | $122,800 | $178,500 |
| 2023 | $1,468 | $270,700 | $116,700 | $154,000 |
| 2022 | $1,597 | $287,600 | $114,400 | $173,200 |
| 2021 | $1,565 | $240,000 | $89,600 | $150,400 |
| 2020 | $1,457 | $210,700 | $89,600 | $121,100 |
| 2019 | $1,373 | $193,500 | $89,600 | $103,900 |
| 2018 | $1,211 | $177,600 | $69,700 | $107,900 |
| 2017 | $1,160 | $162,600 | $64,500 | $98,100 |
| 2016 | $1,093 | $148,100 | $64,500 | $83,600 |
| 2015 | $1,243 | $155,900 | $65,800 | $90,100 |
| 2014 | $1,216 | $149,400 | $63,800 | $85,600 |
Map
- 8732 S 620 E
- 541 Mingo View Ave
- 8947 S 500 E
- 412 E 8760 S
- 8797 Green Way Unit 3
- 8722 S Oakwood Park Cir
- 499 E 8575 S
- 265 E 8880 S Unit 12
- 413 E 9120 S
- 8780 S 250 E
- 448 E 9150 S
- 362 E 9150 S
- 876 E Chariot Dr
- 9239 S Brighton View Dr
- 8447 Mayfly Way
- 9092 Enchanted Oak Ln
- 859 E 8600 S
- 744 E 8425 S
- 9101 S Enchanted Oak Ln
- 359 E 8400 S
Ask me questions while you tour the home.