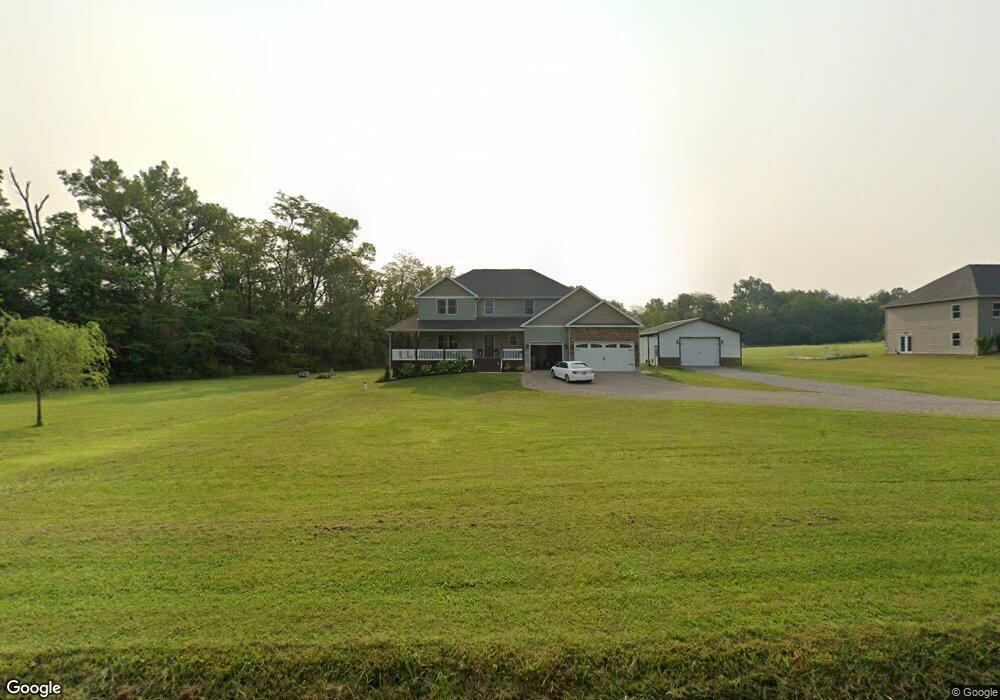
8847 Licking Trails Rd SE Unit Lot 7 Jacksontown, OH 43030
Estimated Value: $696,000 - $758,000
4
Beds
4
Baths
2,832
Sq Ft
$257/Sq Ft
Est. Value
About This Home
This home is located at 8847 Licking Trails Rd SE Unit Lot 7, Jacksontown, OH 43030 and is currently estimated at $729,235, approximately $257 per square foot. 8847 Licking Trails Rd SE Unit Lot 7 is a home located in Licking County with nearby schools including Jackson Intermediate School, Lakewood Middle School, and Lakewood High School.
Ownership History
Date
Name
Owned For
Owner Type
Purchase Details
Closed on
Oct 7, 2019
Sold by
Swiantek Aaron C and Swiantek Vanessa J
Bought by
Salyer Brandon J and Salyer Julie A
Current Estimated Value
Home Financials for this Owner
Home Financials are based on the most recent Mortgage that was taken out on this home.
Original Mortgage
$385,870
Outstanding Balance
$337,346
Interest Rate
3.4%
Mortgage Type
New Conventional
Estimated Equity
$391,889
Purchase Details
Closed on
Dec 22, 2015
Sold by
Green Jonathan A
Bought by
Swiantek Aaron C and Swiantek Vanessa J
Home Financials for this Owner
Home Financials are based on the most recent Mortgage that was taken out on this home.
Original Mortgage
$251,750
Interest Rate
3.93%
Mortgage Type
New Conventional
Purchase Details
Closed on
Nov 20, 2014
Sold by
Gillenwater William and Gillenwater Connie
Bought by
Green Jonathan A
Create a Home Valuation Report for This Property
The Home Valuation Report is an in-depth analysis detailing your home's value as well as a comparison with similar homes in the area
Home Values in the Area
Average Home Value in this Area
Purchase History
| Date | Buyer | Sale Price | Title Company |
|---|---|---|---|
| Salyer Brandon J | $410,500 | Chicago Title | |
| Swiantek Aaron C | $397,500 | Attorney | |
| Green Jonathan A | $36,750 | Chicago Title |
Source: Public Records
Mortgage History
| Date | Status | Borrower | Loan Amount |
|---|---|---|---|
| Open | Salyer Brandon J | $385,870 | |
| Previous Owner | Swiantek Aaron C | $251,750 |
Source: Public Records
Tax History Compared to Growth
Tax History
| Year | Tax Paid | Tax Assessment Tax Assessment Total Assessment is a certain percentage of the fair market value that is determined by local assessors to be the total taxable value of land and additions on the property. | Land | Improvement |
|---|---|---|---|---|
| 2024 | $6,785 | $180,010 | $32,900 | $147,110 |
| 2023 | $6,807 | $180,010 | $32,900 | $147,110 |
| 2022 | $5,914 | $134,830 | $23,910 | $110,920 |
| 2021 | $5,794 | $128,250 | $23,910 | $104,340 |
| 2020 | $5,804 | $128,250 | $23,910 | $104,340 |
| 2019 | $4,735 | $98,280 | $17,080 | $81,200 |
| 2018 | $4,554 | $0 | $0 | $0 |
| 2017 | $2,620 | $0 | $0 | $0 |
| 2016 | $4,401 | $0 | $0 | $0 |
| 2015 | $540 | $0 | $0 | $0 |
| 2014 | $296 | $0 | $0 | $0 |
| 2013 | $827 | $0 | $0 | $0 |
Source: Public Records
Map
Nearby Homes
- 7233 National Rd SE
- 6281 Davis Dr
- 8981 Fairmont Rd
- 225 Pleasant Lee Dr
- 7691 Lake Drive Rd
- 132 North Ct
- 0 Fairmont Rd Unit Lot 2 225009040
- 0 Fairmont Rd Unit Lot 3 225009043
- 11790 Avondale Rd E
- 0 Harbor View Dr Unit 223038206
- 557 Lexington Ave
- 36 High St
- 149 Amherst Dr
- 541 Lakeshore Dr E
- 0 Avon Place SE Unit 410 225019607
- 459 Lakeshore Dr E
- 206 Freeman Memorial Dr
- 955 Lakeshore Dr E
- 22 Barton Place
- 2453 Ryan Rd
- 8847 Licking Trail Rd
- 8847 Licking Trail Rd Unit Lot 7
- 8847 Licking Trails Rd Unit LOT 7
- 8849 Licking Trails Rd SE Unit Lot 8
- 8849 Licking Trail Rd
- 8849 Licking Trail Rd Unit LOT 8
- 8849 Licking Trails Rd
- 8751 Licking Trails Rd SE Unit Lot 6
- 8751 Licking Trails Rd SE
- 8751 Licking Trail Rd Unit Lot 6
- 8751 Licking Trails Rd
- 8909 Licking Trail Rd SE Unit Lot 9
- 8909 Licking Trail Rd
- 8909 Licking Trail Rd Unit LOT 9
- 8751 Licking Trails Rd Unit LOT 6
- 8751 Licking Trails Rd
- 8228 Licking Trails Rd
- 8749 Licking Trails Rd SE Unit Lot 5
- 8749 Licking Trail Rd
- 8749 Licking Trail Rd Unit Lot 5