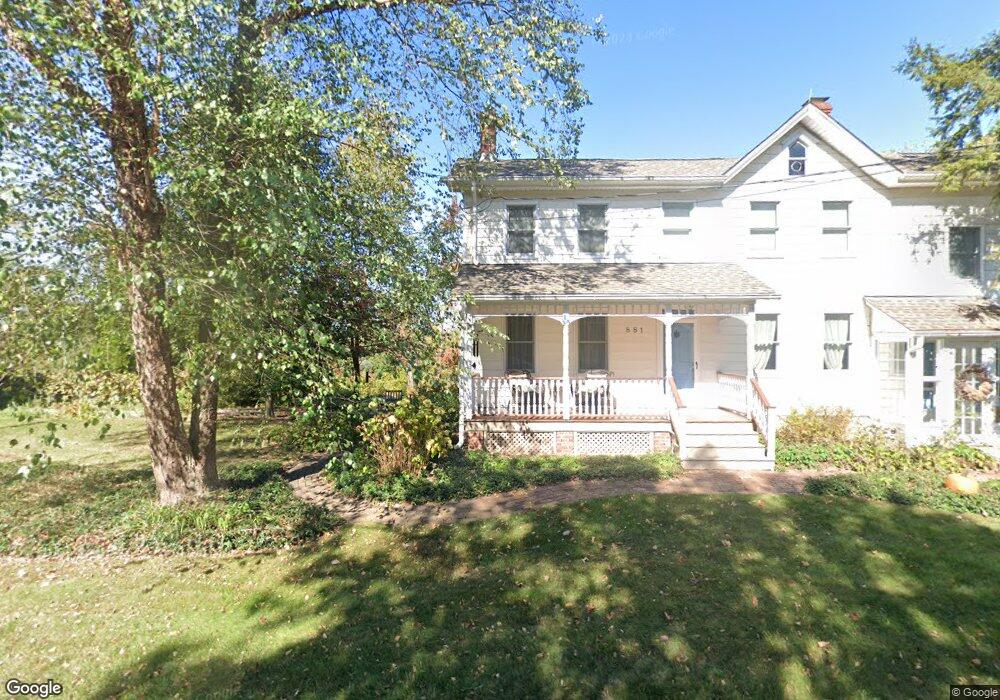
885 Amwell Rd Hillsborough, NJ 08844
Estimated Value: $413,000 - $622,000
3
Beds
3
Baths
1,524
Sq Ft
$371/Sq Ft
Est. Value
About This Home
This home is located at 885 Amwell Rd, Hillsborough, NJ 08844 and is currently estimated at $564,890, approximately $370 per square foot. 885 Amwell Rd is a home located in Somerset County with nearby schools including Hillsborough High School.
Ownership History
Date
Name
Owned For
Owner Type
Purchase Details
Closed on
Feb 19, 2021
Sold by
Martinez David S and Di Giulio Tara
Bought by
Martinez David S and Martinez Tara Marie
Current Estimated Value
Home Financials for this Owner
Home Financials are based on the most recent Mortgage that was taken out on this home.
Original Mortgage
$236,492
Outstanding Balance
$193,082
Interest Rate
2.73%
Mortgage Type
New Conventional
Estimated Equity
$371,808
Purchase Details
Closed on
Mar 28, 2003
Sold by
Stanislaski Gena
Bought by
Martinez David and Di Giulio Tara
Home Financials for this Owner
Home Financials are based on the most recent Mortgage that was taken out on this home.
Original Mortgage
$299,250
Interest Rate
5.86%
Purchase Details
Closed on
Feb 14, 1996
Sold by
Bosetti Josephine Gorman
Bought by
Stanislaski James
Home Financials for this Owner
Home Financials are based on the most recent Mortgage that was taken out on this home.
Original Mortgage
$132,000
Interest Rate
7.02%
Create a Home Valuation Report for This Property
The Home Valuation Report is an in-depth analysis detailing your home's value as well as a comparison with similar homes in the area
Home Values in the Area
Average Home Value in this Area
Purchase History
| Date | Buyer | Sale Price | Title Company |
|---|---|---|---|
| Martinez David S | -- | National Integrity Llc | |
| Martinez David | $315,000 | -- | |
| Stanislaski James | $165,000 | -- |
Source: Public Records
Mortgage History
| Date | Status | Borrower | Loan Amount |
|---|---|---|---|
| Open | Martinez David S | $236,492 | |
| Closed | Martinez David | $299,250 | |
| Previous Owner | Stanislaski James | $132,000 |
Source: Public Records
Tax History Compared to Growth
Tax History
| Year | Tax Paid | Tax Assessment Tax Assessment Total Assessment is a certain percentage of the fair market value that is determined by local assessors to be the total taxable value of land and additions on the property. | Land | Improvement |
|---|---|---|---|---|
| 2025 | $9,328 | $473,900 | $279,100 | $194,800 |
| 2024 | $9,328 | $435,300 | $269,100 | $166,200 |
| 2023 | $8,463 | $393,100 | $229,100 | $164,000 |
| 2022 | $8,443 | $378,100 | $214,100 | $164,000 |
| 2021 | $8,108 | $345,300 | $204,100 | $141,200 |
| 2020 | $8,232 | $345,300 | $204,100 | $141,200 |
| 2019 | $7,724 | $321,300 | $184,100 | $137,200 |
| 2018 | $7,673 | $317,200 | $179,100 | $138,100 |
| 2017 | $7,697 | $318,700 | $179,100 | $139,600 |
| 2016 | $7,592 | $314,500 | $174,100 | $140,400 |
| 2015 | $7,395 | $310,200 | $174,100 | $136,100 |
| 2014 | $7,240 | $310,200 | $174,100 | $136,100 |
Source: Public Records
Map
Nearby Homes
- 872 Amwell Rd
- 68 Clover Hill Rd
- 5 Rea Ct
- 205 Hockenbury Rd
- 581 Montgomery Rd
- 30 Claridge Ln
- 1 Meadow Run Way
- 18 Burnett Ct
- 1 Shady Ln
- 10 Samuel Dr
- 91 Briar Way
- 623 Montgomery Rd
- 12 Forest Hill Dr
- 34 Lehigh Rd
- 12 Woodside Ln
- 6 Elm Terrace
- 23 Maple Ct
- 752 Amwell Rd
- 247 Summer Rd
- 200 Milkweed Ct Unit 200