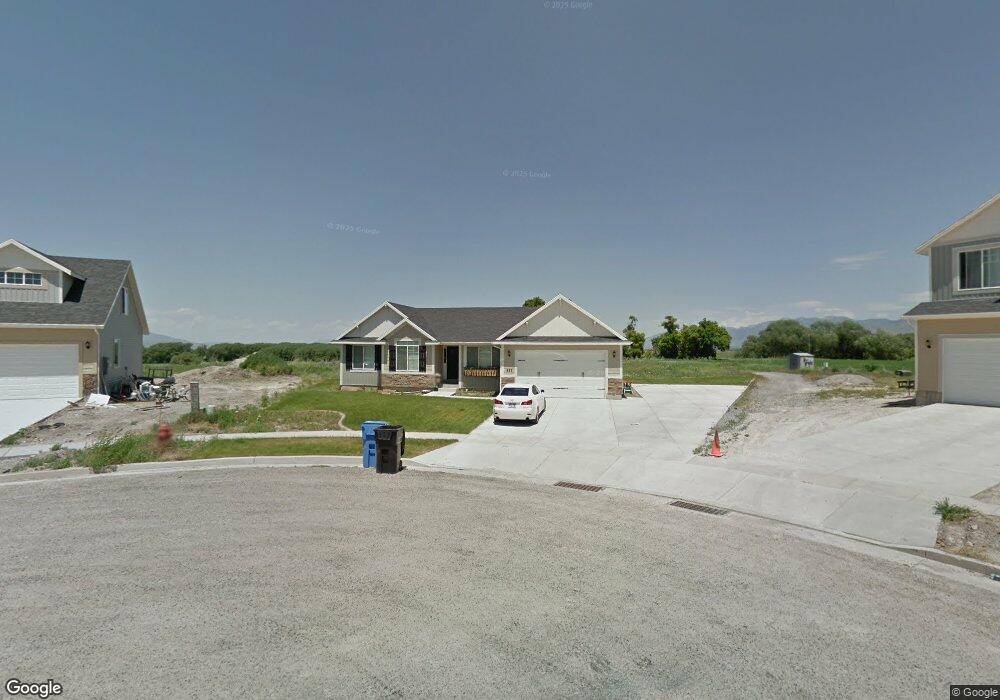
885 E 675 N Unit 26 Wellsville, UT 84339
Estimated Value: $537,000 - $619,000
3
Beds
2
Baths
3,310
Sq Ft
$174/Sq Ft
Est. Value
About This Home
This home is located at 885 E 675 N Unit 26, Wellsville, UT 84339 and is currently estimated at $574,431, approximately $173 per square foot. 885 E 675 N Unit 26 is a home located in Cache County with nearby schools including Wellsville School, South Cache Middle School, and Mountain Crest High School.
Ownership History
Date
Name
Owned For
Owner Type
Purchase Details
Closed on
Jun 10, 2015
Sold by
Wellington Kathryn Kaylyn
Bought by
Jorgensen Casey B and Jorgensen Amy L
Current Estimated Value
Home Financials for this Owner
Home Financials are based on the most recent Mortgage that was taken out on this home.
Original Mortgage
$216,125
Outstanding Balance
$166,735
Interest Rate
3.64%
Mortgage Type
New Conventional
Estimated Equity
$407,696
Purchase Details
Closed on
Aug 3, 2011
Sold by
Aj Addison Inc
Bought by
Immaculate Llc
Purchase Details
Closed on
Aug 4, 2006
Sold by
Heritage Southwest Estates Llc
Bought by
Aj Addison Inc
Home Financials for this Owner
Home Financials are based on the most recent Mortgage that was taken out on this home.
Original Mortgage
$136,800
Interest Rate
6.76%
Mortgage Type
Purchase Money Mortgage
Create a Home Valuation Report for This Property
The Home Valuation Report is an in-depth analysis detailing your home's value as well as a comparison with similar homes in the area
Home Values in the Area
Average Home Value in this Area
Purchase History
| Date | Buyer | Sale Price | Title Company |
|---|---|---|---|
| Jorgensen Casey B | -- | Highland Title | |
| Immaculate Llc | -- | Cache Title Company | |
| Wellington Kathryn Kaylyn | -- | Cache Title Company | |
| Aj Addison Inc | -- | Cache Title Company |
Source: Public Records
Mortgage History
| Date | Status | Borrower | Loan Amount |
|---|---|---|---|
| Open | Jorgensen Casey B | $216,125 | |
| Previous Owner | Aj Addison Inc | $136,800 |
Source: Public Records
Tax History Compared to Growth
Tax History
| Year | Tax Paid | Tax Assessment Tax Assessment Total Assessment is a certain percentage of the fair market value that is determined by local assessors to be the total taxable value of land and additions on the property. | Land | Improvement |
|---|---|---|---|---|
| 2024 | $2,498 | $336,655 | $0 | $0 |
| 2023 | $2,509 | $318,505 | $0 | $0 |
| 2022 | $2,587 | $318,505 | $0 | $0 |
| 2021 | $2,200 | $413,500 | $55,000 | $358,500 |
| 2020 | $1,567 | $279,498 | $55,000 | $224,498 |
| 2019 | $1,649 | $279,498 | $55,000 | $224,498 |
| 2018 | $1,545 | $255,445 | $55,000 | $200,445 |
| 2017 | $1,556 | $135,245 | $0 | $0 |
| 2016 | $1,589 | $119,625 | $0 | $0 |
| 2015 | $1,405 | $119,625 | $0 | $0 |
| 2014 | $1,233 | $107,880 | $0 | $0 |
| 2013 | -- | $107,880 | $0 | $0 |
Source: Public Records
Map
Nearby Homes
- 4633 S Highway 89
- 672 E Main St
- 3359 W 3500 S
- 285 N 100 E
- 3300 W 5400 S
- 83 W 300 N Unit 4
- 170 W 500 N
- 338 N 1090 W
- 15 E Main St
- 275 S 300 E
- 253 N Red Slide Dr
- 135 S Center St
- 2815 W 5700 S Unit 1
- 2815 W 5700 S Unit 2
- 42 E 200 S
- 885 W 300 N
- 136 S 200 W
- 670 W 300 N
- Scottsford Plan at Spring Hollow
- Lunae (add-on ADU above separate garage) Plan at Spring Hollow