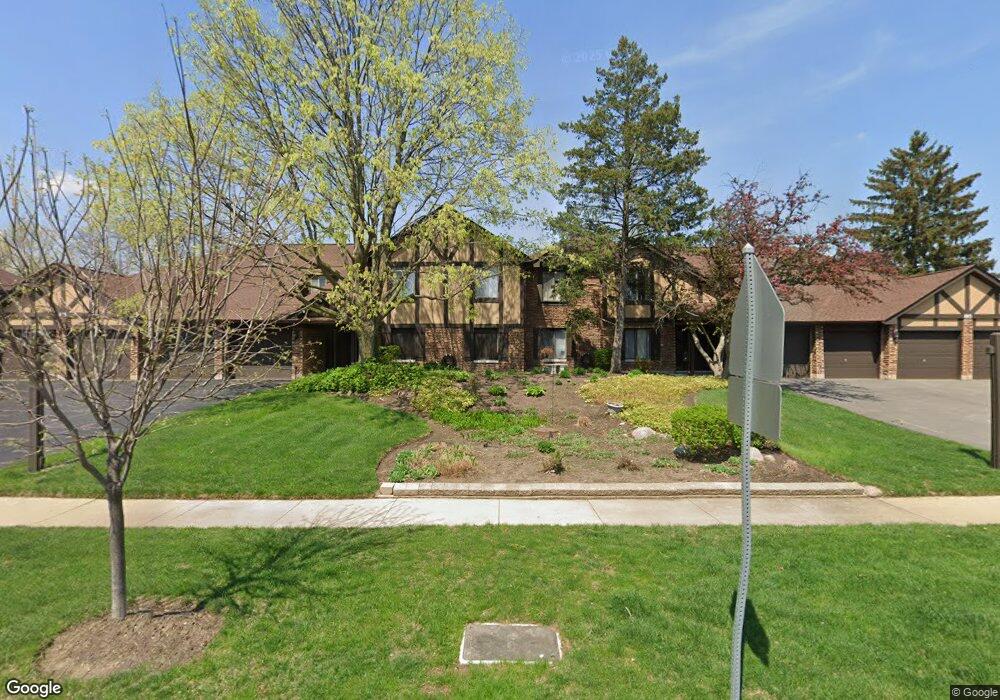
885 Farnham Ln Unit D Wheaton, IL 60189
Southeast Wheaton NeighborhoodEstimated Value: $239,975 - $273,000
2
Beds
1
Bath
1,100
Sq Ft
$233/Sq Ft
Est. Value
About This Home
This home is located at 885 Farnham Ln Unit D, Wheaton, IL 60189 and is currently estimated at $256,244, approximately $232 per square foot. 885 Farnham Ln Unit D is a home located in DuPage County with nearby schools including Lincoln Elementary School, Haines Elementary School, and Nelson Prairie School.
Ownership History
Date
Name
Owned For
Owner Type
Purchase Details
Closed on
Jul 22, 2020
Sold by
West Cherry E
Bought by
West Cherry E and Cherry E West Trust
Current Estimated Value
Purchase Details
Closed on
Sep 8, 2008
Sold by
Pohlman Barbara A and Meske Kimberly A
Bought by
West Cherry E and Purst Charles
Home Financials for this Owner
Home Financials are based on the most recent Mortgage that was taken out on this home.
Original Mortgage
$160,137
Outstanding Balance
$106,768
Interest Rate
6.57%
Mortgage Type
FHA
Estimated Equity
$149,476
Purchase Details
Closed on
Dec 21, 2004
Sold by
Pohlman Barbara A and Estate Of Lorretta O Barnes
Bought by
Pohlman Barbara A and Pohlman Kimberly A
Purchase Details
Closed on
Oct 17, 2000
Sold by
Stanek John G and Stanek Marcia
Bought by
Barnes Lorretta
Purchase Details
Closed on
Feb 27, 1998
Sold by
Stanek John G and Stanek Marcia
Bought by
Stanek John G and Stanek Marcia
Create a Home Valuation Report for This Property
The Home Valuation Report is an in-depth analysis detailing your home's value as well as a comparison with similar homes in the area
Home Values in the Area
Average Home Value in this Area
Purchase History
| Date | Buyer | Sale Price | Title Company |
|---|---|---|---|
| West Cherry E | -- | None Available | |
| West Cherry E | $162,500 | Atg | |
| Pohlman Barbara A | -- | -- | |
| Barnes Lorretta | $119,000 | First American Title Ins | |
| Stanek John G | -- | -- |
Source: Public Records
Mortgage History
| Date | Status | Borrower | Loan Amount |
|---|---|---|---|
| Open | West Cherry E | $160,137 |
Source: Public Records
Tax History Compared to Growth
Tax History
| Year | Tax Paid | Tax Assessment Tax Assessment Total Assessment is a certain percentage of the fair market value that is determined by local assessors to be the total taxable value of land and additions on the property. | Land | Improvement |
|---|---|---|---|---|
| 2024 | $3,252 | $58,449 | $7,290 | $51,159 |
| 2023 | $3,095 | $53,800 | $6,710 | $47,090 |
| 2022 | $3,031 | $49,770 | $5,390 | $44,380 |
| 2021 | $3,014 | $48,590 | $5,260 | $43,330 |
| 2020 | $3,002 | $48,140 | $5,210 | $42,930 |
| 2019 | $2,926 | $46,870 | $5,070 | $41,800 |
| 2018 | $2,693 | $43,180 | $4,780 | $38,400 |
| 2017 | $2,458 | $39,120 | $4,330 | $34,790 |
| 2016 | $2,304 | $37,560 | $4,160 | $33,400 |
| 2015 | $2,271 | $35,830 | $3,970 | $31,860 |
| 2014 | $2,787 | $41,700 | $4,390 | $37,310 |
| 2013 | $2,716 | $41,820 | $4,400 | $37,420 |
Source: Public Records
Map
Nearby Homes
- 1038 Liskeard Ct
- 1026 Briarcliffe Blvd
- 1244 Loughborough Ct
- 1129 Rhodes Ct
- 1123 Grant St
- 1010 Heathrow Ct
- 1631 Southampton Ct
- 1547 Huntleigh Dr
- 1581 Groton Ln
- 1687 Williamsburg Ct Unit A
- 1694 Farragut Ct Unit A
- 1150 Mount Vernon Ct Unit C
- 1316 Wilson Ave
- 512 Pershing Ave
- 1407 Wilson Ave
- 220 E Elm St
- 1240 S Lorraine Rd Unit 2B
- 215 Orchard Ln
- 104 E Elm St
- 1000 S Lorraine Rd Unit 412
- 1450 Johnstown Ln Unit C
- 1465 Johnstown Ln Unit 2004
- 1401 Princeton Ct Unit 1704
- 845 Sheldon Ct Unit B
- 885 Farnham Ln Unit 1105
- 1450 Johnstown Ln
- 845 Sheldon Ct Unit C
- 1471 Haverhill Dr Unit C
- 1408 Princeton Ct Unit A
- 1421 Princeton Ct Unit 1805
- 845 Farnham Ln Unit C
- 1408 Princeton Ct Unit B
- 1402 Princeton Ct Unit C
- 1421 Princeton Ct Unit B
- 855 Johnstown Ln Unit B
- 1412 Princeton Ct Unit C
- 1485 Johnstown Ln Unit D
- 1450 Johnstown Ln Unit 1306D
- 1461 Haverhill Dr Unit A
- 1475 Johnstown Ln Unit B