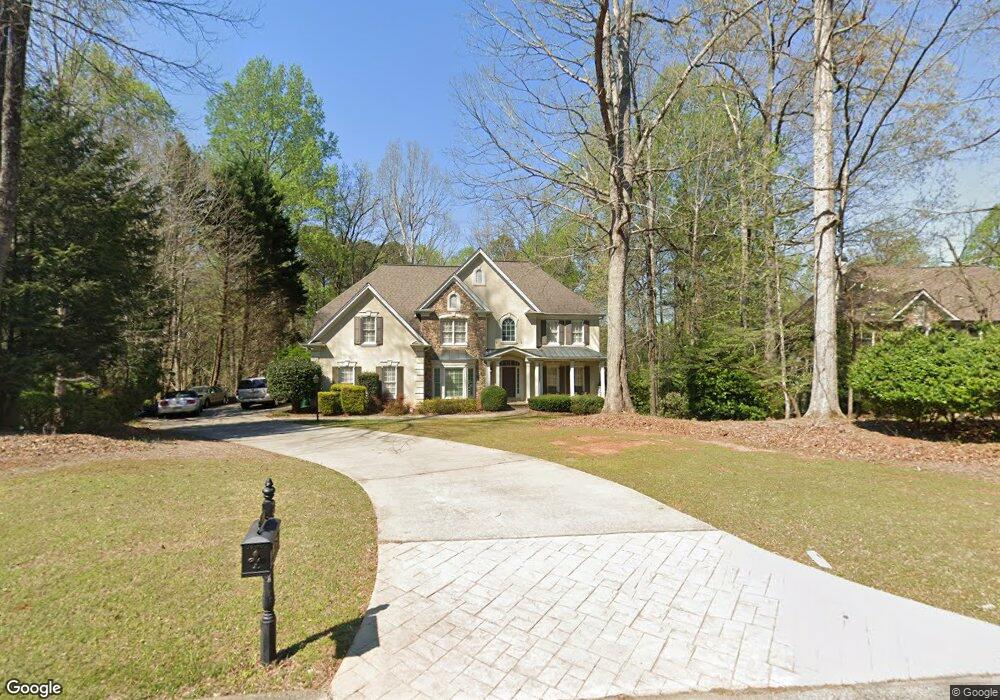
885 Hampton Bluff Dr Unit 1 Alpharetta, GA 30004
Estimated Value: $942,000 - $1,288,000
6
Beds
5
Baths
3,158
Sq Ft
$361/Sq Ft
Est. Value
About This Home
This home is located at 885 Hampton Bluff Dr Unit 1, Alpharetta, GA 30004 and is currently estimated at $1,140,670, approximately $361 per square foot. 885 Hampton Bluff Dr Unit 1 is a home located in Fulton County with nearby schools including Birmingham Falls Elementary School, Northwestern Middle School, and Cambridge High School.
Ownership History
Date
Name
Owned For
Owner Type
Purchase Details
Closed on
Jan 21, 2011
Sold by
Citimortgage
Bought by
Phillips Lee
Current Estimated Value
Home Financials for this Owner
Home Financials are based on the most recent Mortgage that was taken out on this home.
Original Mortgage
$314,300
Outstanding Balance
$214,689
Interest Rate
4.82%
Mortgage Type
New Conventional
Estimated Equity
$925,981
Purchase Details
Closed on
Sep 7, 2010
Sold by
Henderson Charles B and Henderson Shannon L
Bought by
Citimortgage
Purchase Details
Closed on
Aug 7, 2007
Sold by
Henderson Charles B and Henderson Shannon L
Bought by
Henderson Shannon L
Purchase Details
Closed on
May 14, 1999
Sold by
Ruland Michael M and Ruland Elisa S
Bought by
Solly Carl W and Solly Claire L
Purchase Details
Closed on
Apr 12, 1996
Sold by
Redden Props Inc
Bought by
Ruland Michael M Elisa
Create a Home Valuation Report for This Property
The Home Valuation Report is an in-depth analysis detailing your home's value as well as a comparison with similar homes in the area
Home Values in the Area
Average Home Value in this Area
Purchase History
| Date | Buyer | Sale Price | Title Company |
|---|---|---|---|
| Phillips Lee | $449,000 | -- | |
| Citimortgage | $358,454 | -- | |
| Henderson Shannon L | -- | -- | |
| Solly Carl W | $159,000 | -- | |
| Ruland Michael M Elisa | $363,000 | -- |
Source: Public Records
Mortgage History
| Date | Status | Borrower | Loan Amount |
|---|---|---|---|
| Open | Phillips Lee | $314,300 | |
| Closed | Ruland Michael M Elisa | $0 |
Source: Public Records
Tax History Compared to Growth
Tax History
| Year | Tax Paid | Tax Assessment Tax Assessment Total Assessment is a certain percentage of the fair market value that is determined by local assessors to be the total taxable value of land and additions on the property. | Land | Improvement |
|---|---|---|---|---|
| 2025 | $1,525 | $363,600 | $137,040 | $226,560 |
| 2023 | $9,052 | $320,680 | $77,600 | $243,080 |
| 2022 | $6,122 | $232,680 | $69,640 | $163,040 |
| 2021 | $5,278 | $194,560 | $57,240 | $137,320 |
| 2020 | $5,557 | $199,960 | $62,400 | $137,560 |
| 2019 | $1,074 | $201,960 | $55,480 | $146,480 |
| 2018 | $5,567 | $197,240 | $54,200 | $143,040 |
| 2017 | $5,755 | $197,240 | $54,200 | $143,040 |
| 2016 | $6,128 | $210,000 | $62,440 | $147,560 |
| 2015 | $7,147 | $210,000 | $62,440 | $147,560 |
| 2014 | $5,674 | $185,120 | $59,960 | $125,160 |
Source: Public Records
Map
Nearby Homes
- 310 Glen Hampton Place
- 711 Hallbrook Ct
- 110 von Lake Dr
- 115 von Lake Dr
- 1160 Nix Rd
- 325 White Columns Ct
- 225 Brock Trail Unit 2
- 225 Brock Trail
- 235 Brock Trail
- 235 Brock Trail Unit 3
- 230 Brock Trail
- 230 Brock Trail Unit 5
- 240 Brock Trail
- 240 Brock Trail Unit 4
- 15040 Freemanville Rd
- 15475 Birmingham Hwy
- 1004 Crossroads Trail
- 1009 Crossroads Trail
- 1013 Crossroads Trail
- 15750 Freemanville Rd
- 885 Hampton Bluff Dr
- 875 Hampton Bluff Dr
- 905 Hampton Bluff Dr
- 865 Hampton Bluff Dr Unit 1
- 920 Treyburn Run Unit 3B
- 910 Treyburn Run Unit 3B
- 830 Hampton Bluff Dr
- 930 Treyburn Run
- 840 Hampton Bluff Dr
- 600 Hampton Bluff Ln
- 915 Hampton Bluff Dr
- 855 Hampton Bluff Dr
- 940 Treyburn Run Unit 3B
- 0 Treyburn Run
- 820 Hampton Bluff Dr
- 845 Hampton Bluff Dr
- 900 Treyburn Run
- 925 Hampton Bluff Dr
- 950 Treyburn Run
- 870 Hampton Bluff Dr