885 Ranchette Place Calhan, CO 80808
Estimated Value: $302,372 - $460,000
3
Beds
2
Baths
3,344
Sq Ft
$115/Sq Ft
Est. Value
About This Home
This home is located at 885 Ranchette Place, Calhan, CO 80808 and is currently estimated at $385,093, approximately $115 per square foot. 885 Ranchette Place is a home located in El Paso County with nearby schools including Ellicott Elementary School, Ellicott Middle School, and Ellicott Senior High School.
Ownership History
Date
Name
Owned For
Owner Type
Purchase Details
Closed on
Oct 13, 2009
Sold by
Mccarthy William J and Snead Dorothy L
Bought by
Drury Donald R and Drury Ixchel J
Current Estimated Value
Home Financials for this Owner
Home Financials are based on the most recent Mortgage that was taken out on this home.
Original Mortgage
$127,546
Outstanding Balance
$83,371
Interest Rate
5.1%
Mortgage Type
FHA
Estimated Equity
$301,722
Purchase Details
Closed on
Jan 12, 1999
Sold by
Clayton Custom Homes Llc
Bought by
Mccarthy William J and Snead Dorothy L
Home Financials for this Owner
Home Financials are based on the most recent Mortgage that was taken out on this home.
Original Mortgage
$114,162
Interest Rate
6.66%
Mortgage Type
FHA
Purchase Details
Closed on
Jan 7, 1991
Bought by
Drury Ixchel J
Purchase Details
Closed on
May 7, 1986
Bought by
Drury Ixchel J
Purchase Details
Closed on
Nov 5, 1984
Bought by
Drury Ixchel J
Create a Home Valuation Report for This Property
The Home Valuation Report is an in-depth analysis detailing your home's value as well as a comparison with similar homes in the area
Home Values in the Area
Average Home Value in this Area
Purchase History
| Date | Buyer | Sale Price | Title Company |
|---|---|---|---|
| Drury Donald R | $129,900 | Cb Title | |
| Mccarthy William J | $114,900 | -- | |
| Drury Ixchel J | -- | -- | |
| Drury Ixchel J | -- | -- | |
| Drury Ixchel J | $700,000 | -- |
Source: Public Records
Mortgage History
| Date | Status | Borrower | Loan Amount |
|---|---|---|---|
| Open | Drury Donald R | $127,546 | |
| Previous Owner | Mccarthy William J | $114,162 |
Source: Public Records
Tax History Compared to Growth
Tax History
| Year | Tax Paid | Tax Assessment Tax Assessment Total Assessment is a certain percentage of the fair market value that is determined by local assessors to be the total taxable value of land and additions on the property. | Land | Improvement |
|---|---|---|---|---|
| 2025 | $1,103 | $28,630 | -- | -- |
| 2024 | $929 | $23,770 | $6,370 | $17,400 |
| 2023 | $929 | $23,770 | $6,370 | $17,400 |
| 2022 | $975 | $17,910 | $4,990 | $12,920 |
| 2021 | $918 | $18,420 | $5,130 | $13,290 |
| 2020 | $804 | $15,230 | $4,610 | $10,620 |
| 2019 | $797 | $15,230 | $4,610 | $10,620 |
| 2018 | $680 | $12,480 | $4,160 | $8,320 |
| 2017 | $741 | $12,480 | $4,160 | $8,320 |
| 2016 | $696 | $11,640 | $4,300 | $7,340 |
| 2015 | $693 | $11,640 | $4,300 | $7,340 |
| 2014 | $655 | $10,880 | $4,180 | $6,700 |
Source: Public Records
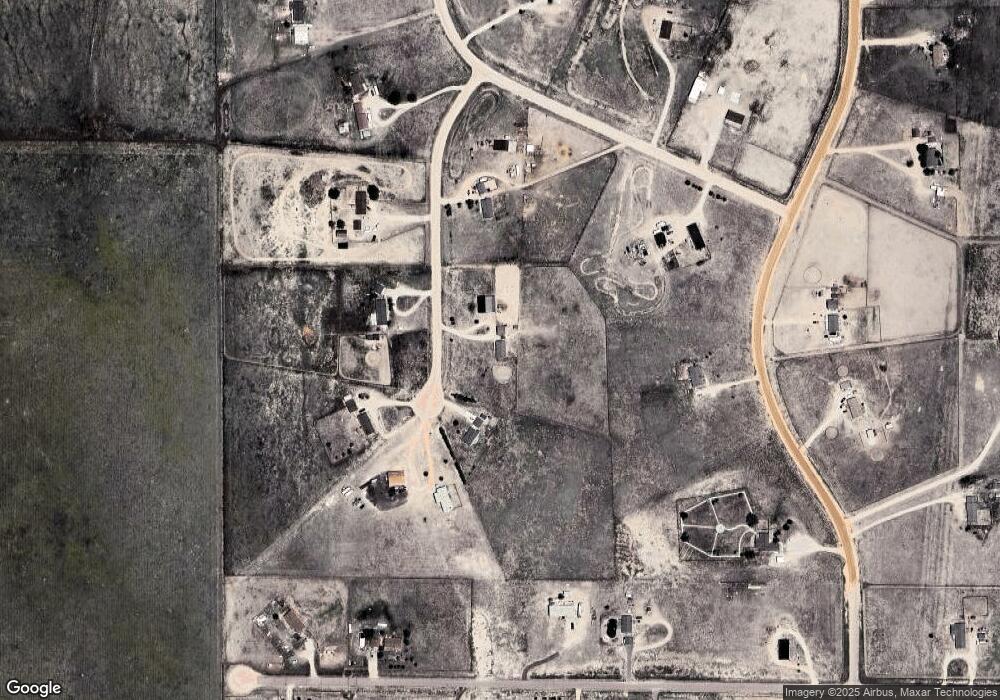
Map
Nearby Homes
- 704 Buffalo Run Rd
- 21406 Chesley Dr
- 21105 Mcdaniels Rd
- 20280 Dusty Spur Trail
- 20120 Dusty Spur Trail
- 21050 Mcdaniels Rd
- 20119 Dusty Spur Trail
- 22036 Cattlemen Run
- 382 Indian Grass St
- 459 Atchison Way
- 471 Atchison Way
- 435 Atchison Way
- 411 Indian Grass St
- 491 Blanket Flower St
- 0 Parcel 2 Peyton Hwy Unit 8332938
- 407 Blanket Flower St
- 22289 Cattlemen Run
- 443 Galveston Terrace
- 485 Galveston Terrace
- 471 Galveston Terrace
- 815 Ranchette Place
- 890 Ranchette Place
- 830 Ranchette Place
- 810 Ranchette Place
- 860 Antelope Dr
- 930 Ranchette Place
- 920 Antelope Dr
- 21020 Goldeneagle Dr
- 980 Ranchette Place
- 21122 Goldeneagle Dr
- 20918 Goldeneagle Dr
- 21140 Ranchette Trail
- 905 Antelope Dr
- 20816 Goldeneagle Dr
- 835 Antelope Dr
- 21060 Ranchette Trail
- 21019 Goldeneagle Dr
- 20990 Ranchette Trail
- 21224 Goldeneagle Dr
- 20975 Ranchette Trail