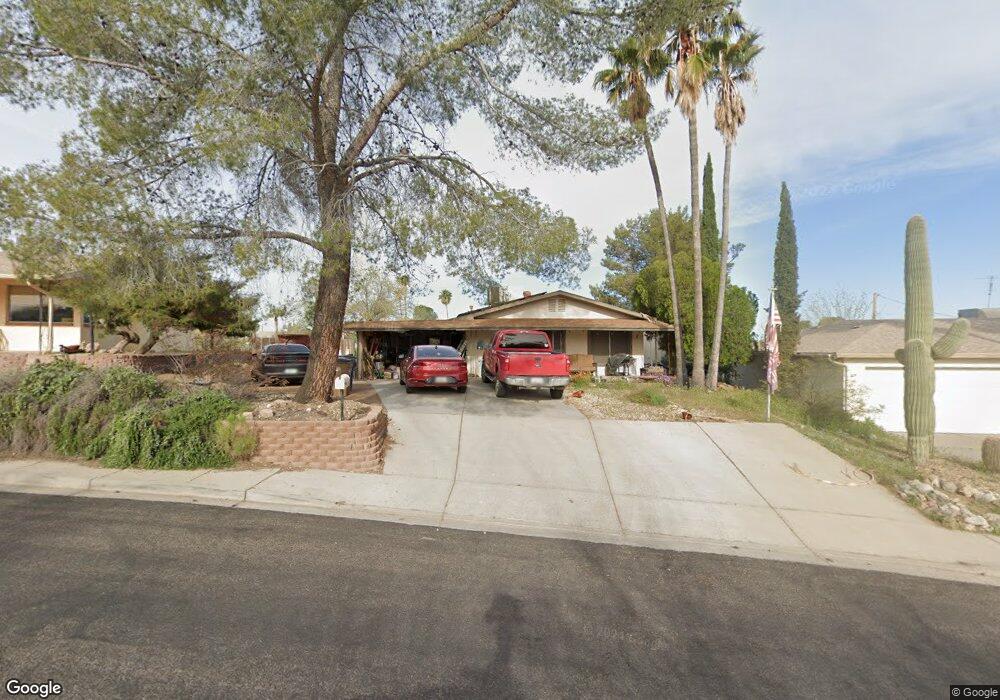
885 S Yaqui Dr Wickenburg, AZ 85390
Estimated Value: $303,754 - $357,000
2
Beds
2
Baths
1,248
Sq Ft
$268/Sq Ft
Est. Value
About This Home
This home is located at 885 S Yaqui Dr, Wickenburg, AZ 85390 and is currently estimated at $333,939, approximately $267 per square foot. 885 S Yaqui Dr is a home located in Maricopa County with nearby schools including Hassayampa Elementary School, Vulture Peak Middle School, and Wickenburg High School.
Ownership History
Date
Name
Owned For
Owner Type
Purchase Details
Closed on
Aug 20, 2014
Sold by
Mcguffin Stuart R and Mcguffin Brittany E
Bought by
Broyles Michael Jarrad
Current Estimated Value
Home Financials for this Owner
Home Financials are based on the most recent Mortgage that was taken out on this home.
Original Mortgage
$159,183
Interest Rate
4.17%
Mortgage Type
New Conventional
Purchase Details
Closed on
Apr 2, 2009
Sold by
Glenn Orton and Glenn Helen
Bought by
Mcguffin Stuart R and Hinkle Brittany E
Home Financials for this Owner
Home Financials are based on the most recent Mortgage that was taken out on this home.
Original Mortgage
$159,065
Interest Rate
5.06%
Mortgage Type
FHA
Purchase Details
Closed on
Jun 23, 2004
Sold by
Denning Daisy
Bought by
Glenn Orton and Glenn Helen
Purchase Details
Closed on
Jan 16, 1996
Sold by
Parks Jerry C and Parks Lillian K
Bought by
Denning Daisy W
Create a Home Valuation Report for This Property
The Home Valuation Report is an in-depth analysis detailing your home's value as well as a comparison with similar homes in the area
Home Values in the Area
Average Home Value in this Area
Purchase History
| Date | Buyer | Sale Price | Title Company |
|---|---|---|---|
| Broyles Michael Jarrad | $156,000 | Pioneer Title Agency Inc | |
| Mcguffin Stuart R | $162,000 | Stewart Title & Trust Of Pho | |
| Glenn Orton | $117,000 | Transnation Title | |
| Denning Daisy W | $79,500 | Lawyers Title Of Arizona Inc |
Source: Public Records
Mortgage History
| Date | Status | Borrower | Loan Amount |
|---|---|---|---|
| Previous Owner | Broyles Michael Jarrad | $159,183 | |
| Previous Owner | Mcguffin Stuart R | $159,065 |
Source: Public Records
Tax History Compared to Growth
Tax History
| Year | Tax Paid | Tax Assessment Tax Assessment Total Assessment is a certain percentage of the fair market value that is determined by local assessors to be the total taxable value of land and additions on the property. | Land | Improvement |
|---|---|---|---|---|
| 2025 | $575 | $10,998 | -- | -- |
| 2024 | $569 | $10,474 | -- | -- |
| 2023 | $569 | $21,130 | $4,220 | $16,910 |
| 2022 | $568 | $17,350 | $3,470 | $13,880 |
| 2021 | $591 | $16,120 | $3,220 | $12,900 |
| 2020 | $594 | $13,280 | $2,650 | $10,630 |
| 2019 | $603 | $12,110 | $2,420 | $9,690 |
| 2018 | $596 | $10,530 | $2,100 | $8,430 |
| 2017 | $596 | $9,130 | $1,820 | $7,310 |
| 2016 | $584 | $9,580 | $1,910 | $7,670 |
| 2015 | $559 | $8,680 | $1,730 | $6,950 |
Source: Public Records
Map
Nearby Homes
- 1875 W Aguila Dr
- 823 Yaqui Dr
- 1660 Vista Dr
- 725 W Smoketree St
- 2040 W Val Vista Dr
- 1855 W Wickenburg Way Unit 142
- 1855 W Wickenburg Way Unit 31
- 1855 W Wickenburg Way Unit 58
- 1855 W Wickenburg Way Unit 25
- 1855 W Wickenburg Way Unit 53
- 1855 W Wickenburg Way Unit 143
- 1855 W Wickenburg Way Unit 149
- 1578 Calle Encantado
- 00XX W Luray Rd
- 100 N Lazy Fox Rd Unit 4
- 780 S Saguaro Dr
- 0 W Wickenburg Way Unit Arizona 24069355
- 969 S Saguaro Dr
- Lot 30 Giana Drive Dr Unit 30
- Lot 33 E Giana Dr Unit 33
- 885 Yaqui Dr
- 895 Yaqui Dr
- 895 S Yaqui Dr
- 875 Yaqui Dr
- 875 Pima Cir
- 1085 S Yaqui Dr
- 1790 Vista Dr
- 1858 W Pima Cir
- 850 Pima Cir
- 1858 Vista Dr
- 17XX Vista Dr Unit F
- 1847 N Aguila Dr
- 1847 N Aguila Dr
- 1835 N Aguila Dr
- 865 Yaqui Dr
- 1795 W Vista Dr
- 880 Yaqui Dr
- 1770 Vista Dr
- 1827 W Aguila Dr
- 1827 W Aguila Dr