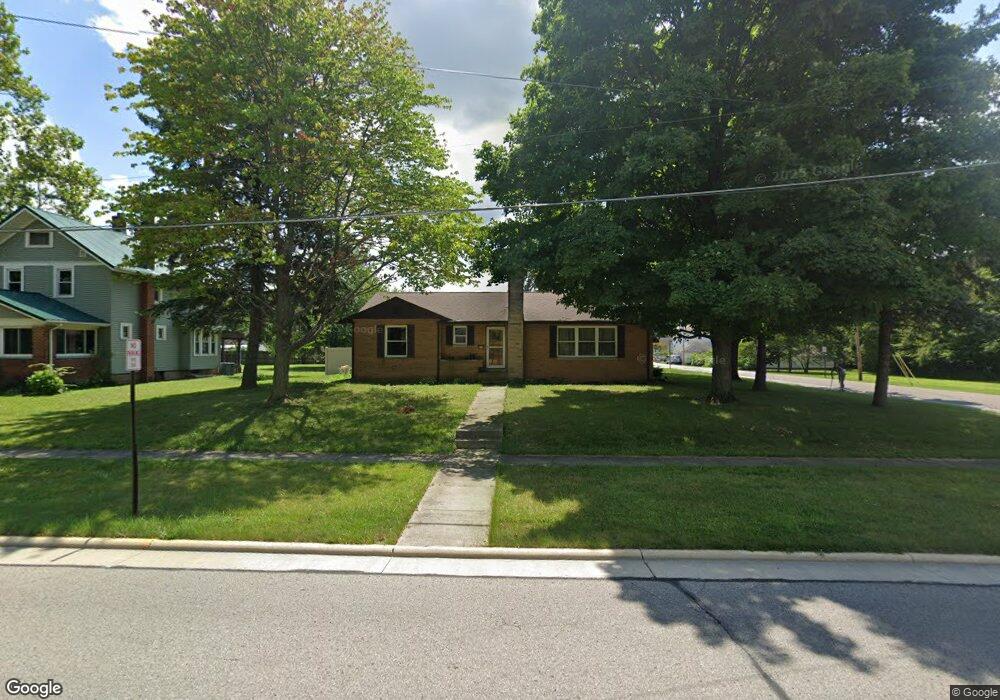
885 W Perry St Bucyrus, OH 44820
Estimated Value: $116,000 - $189,000
3
Beds
2
Baths
1,564
Sq Ft
$101/Sq Ft
Est. Value
About This Home
This home is located at 885 W Perry St, Bucyrus, OH 44820 and is currently estimated at $158,134, approximately $101 per square foot. 885 W Perry St is a home located in Crawford County with nearby schools including Bucyrus Elementary School, Bucyrus Secondary School, and Holy Trinity School.
Ownership History
Date
Name
Owned For
Owner Type
Purchase Details
Closed on
Sep 23, 2025
Sold by
Mee James D and Mee Sue Ellen
Bought by
Jim & Junior Renovations Llc
Current Estimated Value
Purchase Details
Closed on
Apr 2, 2025
Sold by
Zier-Rupe Shannon and Rupe Shannon Rosa
Bought by
Mee James D and Mee Sue E
Home Financials for this Owner
Home Financials are based on the most recent Mortgage that was taken out on this home.
Original Mortgage
$80,000
Interest Rate
6.85%
Mortgage Type
New Conventional
Purchase Details
Closed on
Oct 21, 2020
Sold by
Zier-Leuthold Braxton and Zier-Leuthold Alisha R
Bought by
Zier Shannon and Rupe Shannon
Purchase Details
Closed on
Apr 15, 2016
Sold by
Stock Carol L and Stock David R
Bought by
Powers Margaret A
Home Financials for this Owner
Home Financials are based on the most recent Mortgage that was taken out on this home.
Original Mortgage
$66,400
Interest Rate
3.64%
Mortgage Type
Purchase Money Mortgage
Create a Home Valuation Report for This Property
The Home Valuation Report is an in-depth analysis detailing your home's value as well as a comparison with similar homes in the area
Home Values in the Area
Average Home Value in this Area
Purchase History
| Date | Buyer | Sale Price | Title Company |
|---|---|---|---|
| Jim & Junior Renovations Llc | -- | None Listed On Document | |
| Mee James D | $107,900 | Acs Title | |
| Mee James D | $107,900 | Acs Title | |
| Zier Shannon | $40,000 | Acs Title | |
| Zier Shannon | $40,000 | Acs Title | |
| Powers Margaret A | $83,000 | Acs Title Bucyrus |
Source: Public Records
Mortgage History
| Date | Status | Borrower | Loan Amount |
|---|---|---|---|
| Previous Owner | Mee James D | $80,000 | |
| Previous Owner | Powers Margaret A | $66,400 |
Source: Public Records
Tax History Compared to Growth
Tax History
| Year | Tax Paid | Tax Assessment Tax Assessment Total Assessment is a certain percentage of the fair market value that is determined by local assessors to be the total taxable value of land and additions on the property. | Land | Improvement |
|---|---|---|---|---|
| 2024 | $2,400 | $53,210 | $3,610 | $49,600 |
| 2023 | $1,865 | $34,870 | $3,610 | $31,260 |
| 2022 | $1,860 | $34,870 | $3,610 | $31,260 |
| 2021 | $1,856 | $34,870 | $3,610 | $31,260 |
| 2020 | $1,743 | $30,790 | $3,610 | $27,180 |
| 2019 | $1,233 | $30,790 | $3,610 | $27,180 |
| 2018 | $1,227 | $30,790 | $3,610 | $27,180 |
| 2017 | $1,204 | $29,620 | $3,610 | $26,010 |
| 2016 | $1,701 | $29,620 | $3,610 | $26,010 |
| 2015 | $1,676 | $29,620 | $3,610 | $26,010 |
| 2014 | $1,144 | $29,620 | $3,610 | $26,010 |
| 2013 | $1,144 | $29,620 | $3,610 | $26,010 |
Source: Public Records
Map
Nearby Homes
- 450 Sears St
- 303 W Galen St
- 124 N Spring St
- 508 W Charles St
- 316 W Warren St
- 317 S Spring St
- 314 S Spring St
- 325 W Liberty St
- 603 Kaler Ave
- 531 S Poplar St
- 325 E Mansfield St
- 622 S Poplar St
- 407 E Mansfield St
- 412 E Rensselaer St
- 550 S Walnut St
- 221 W Oakwood Ave
- 121 Emerson St
- 520 E Warren St
- 346 Hopley Ave
- 444 Woodlawn Ave
- 885 W Perry St
- 879 W Perry St
- 873 W Perry St
- 850 W Mary St
- 853 W Perry St
- 838 W Mary St
- 900 W Mary St
- 805 W Perry St
- 830 W Mary St
- 923 W Perry St
- 923 W Perry St
- 824 W Mary St
- 751 W Perry St
- 820 W Perry St
- 841 W Mary St
- 818 W Mary St
- 745 W Perry St
- 901 W Mansfield St
- 903 W Mansfield St
- 825 W Mansfield St