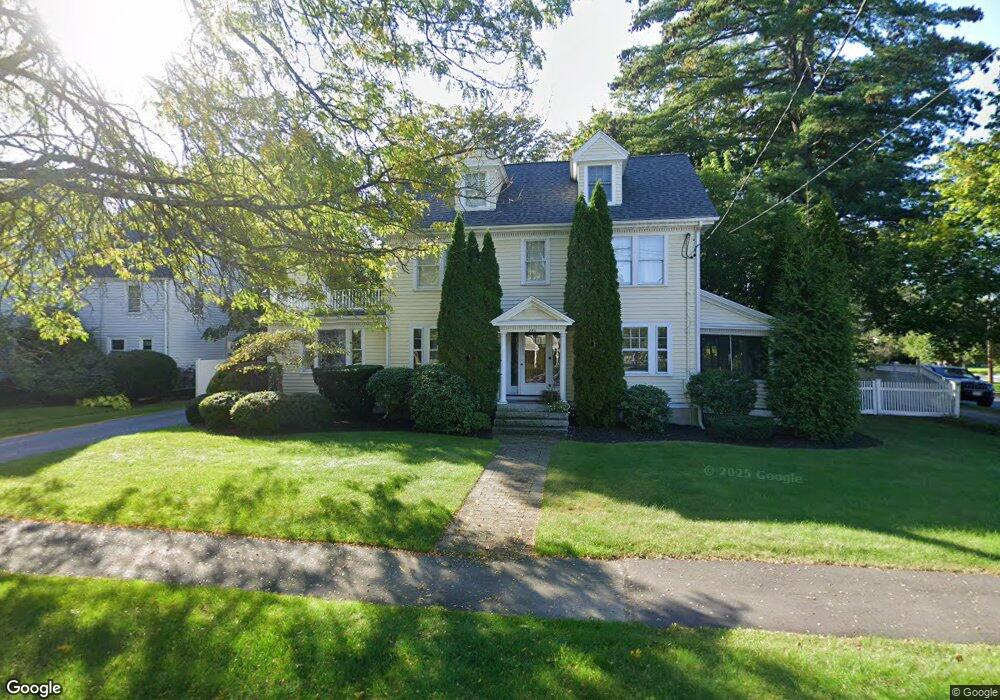
885 Webster St Needham, MA 02492
Estimated Value: $1,508,000 - $1,733,000
4
Beds
2
Baths
2,159
Sq Ft
$764/Sq Ft
Est. Value
About This Home
This home is located at 885 Webster St, Needham, MA 02492 and is currently estimated at $1,648,714, approximately $763 per square foot. 885 Webster St is a home located in Norfolk County with nearby schools including Newman Elementary School, High Rock Middle School, and Pollard Middle School.
Ownership History
Date
Name
Owned For
Owner Type
Purchase Details
Closed on
Jul 26, 2007
Sold by
Komola John A and Komola Christine T
Bought by
Hernberg Philip A and Hernberg Maureen P
Current Estimated Value
Purchase Details
Closed on
Jun 11, 1997
Sold by
Fleming Edward B and Fleming Frances F
Bought by
Komola John A and Komola Christine T
Create a Home Valuation Report for This Property
The Home Valuation Report is an in-depth analysis detailing your home's value as well as a comparison with similar homes in the area
Home Values in the Area
Average Home Value in this Area
Purchase History
| Date | Buyer | Sale Price | Title Company |
|---|---|---|---|
| Hernberg Philip A | $818,000 | -- | |
| Komola John A | $322,500 | -- |
Source: Public Records
Mortgage History
| Date | Status | Borrower | Loan Amount |
|---|---|---|---|
| Open | Komola John A | $200,000 | |
| Open | Komola John A | $417,000 | |
| Closed | Komola John A | $523,750 |
Source: Public Records
Tax History
| Year | Tax Paid | Tax Assessment Tax Assessment Total Assessment is a certain percentage of the fair market value that is determined by local assessors to be the total taxable value of land and additions on the property. | Land | Improvement |
|---|---|---|---|---|
| 2025 | $14,123 | $1,332,400 | $797,300 | $535,100 |
| 2024 | $13,529 | $1,080,600 | $642,800 | $437,800 |
| 2023 | $13,658 | $1,047,400 | $642,800 | $404,600 |
| 2022 | $13,014 | $973,400 | $589,900 | $383,500 |
| 2021 | $12,683 | $973,400 | $589,900 | $383,500 |
| 2020 | $11,988 | $959,800 | $590,100 | $369,700 |
| 2019 | $11,161 | $900,800 | $536,400 | $364,400 |
| 2018 | $10,702 | $900,800 | $536,400 | $364,400 |
| 2017 | $10,172 | $855,500 | $536,400 | $319,100 |
| 2016 | $9,911 | $858,800 | $536,400 | $322,400 |
| 2015 | $9,696 | $858,800 | $536,400 | $322,400 |
| 2014 | $9,246 | $794,300 | $483,800 | $310,500 |
Source: Public Records
Map
Nearby Homes
- 100 Bradford St
- 233 Warren St
- 40 Otis St Unit L
- 68 Pleasant St Unit 68
- 1011 Webster St
- 60 Sutton Rd
- 90 Norfolk St
- 73 Maple St Unit 1
- 193 Garden St
- 19 Highland Ct Unit 19
- 19 Oakland Ave Unit 19
- 638 Webster St
- 638 Webster St Unit 638
- 150 Laurel Dr
- 190 Brookline St
- 47 Emerson Rd
- 510 Webster St
- 569 Chestnut St
- 58 Morton St
- 287 High Rock St
- 893 Webster St
- 893 Webster St Unit 1
- 310 Harris Ave
- 290 Harris Ave
- 897 Webster St
- 897 Webster St Unit 2
- 897 Webster St Unit 1
- 871 Webster St
- 903 Webster St
- 31 Gordon Rd
- 204 Fair Oaks Park
- 198 Fair Oaks Park
- 172 Dedham Ave
- 284 Harris Ave
- 315 Harris Ave
- 180 Dedham Ave
- 210 Fair Oaks Park
- 208 Fair Oaks Park
- 289 Harris Ave
- 863 Webster St
Your Personal Tour Guide
Ask me questions while you tour the home.