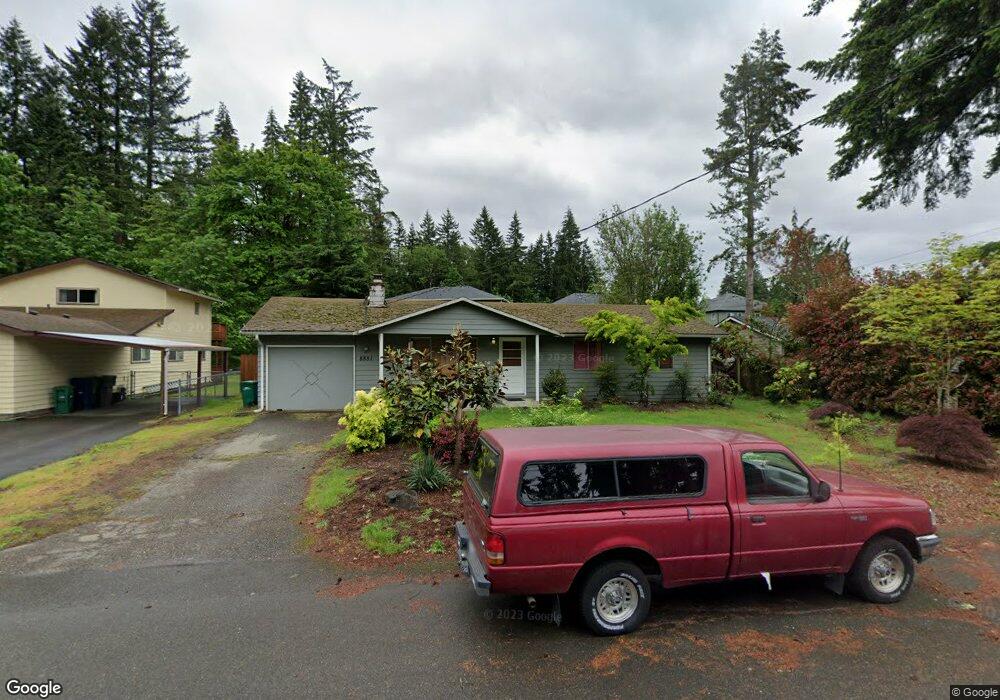
8851 NE 203rd Place Bothell, WA 98011
Westhill NeighborhoodEstimated Value: $773,000 - $1,081,273
3
Beds
1
Bath
1,130
Sq Ft
$798/Sq Ft
Est. Value
About This Home
This home is located at 8851 NE 203rd Place, Bothell, WA 98011 and is currently estimated at $902,068, approximately $798 per square foot. 8851 NE 203rd Place is a home located in King County with nearby schools including Westhill Elementary School, Canyon Park Junior High School, and Bothell High School.
Ownership History
Date
Name
Owned For
Owner Type
Purchase Details
Closed on
May 31, 2001
Sold by
Sandwith Rex A and Delarosa Gemma
Bought by
Lecrenski Robert T
Current Estimated Value
Home Financials for this Owner
Home Financials are based on the most recent Mortgage that was taken out on this home.
Original Mortgage
$197,214
Outstanding Balance
$75,123
Interest Rate
7.14%
Estimated Equity
$826,945
Purchase Details
Closed on
Jan 24, 1998
Sold by
Mcleod Colin D and Mcleod Erika E
Bought by
Sandwith Rex A
Home Financials for this Owner
Home Financials are based on the most recent Mortgage that was taken out on this home.
Original Mortgage
$124,200
Interest Rate
7.05%
Purchase Details
Closed on
Jan 27, 1993
Sold by
Harrison James C and Karen Brandon
Bought by
Mcleod Colin D and Mcleod Erika E
Purchase Details
Closed on
Nov 25, 1992
Sold by
Harrison James C
Bought by
Harrison James Cory and Karen Lee
Create a Home Valuation Report for This Property
The Home Valuation Report is an in-depth analysis detailing your home's value as well as a comparison with similar homes in the area
Home Values in the Area
Average Home Value in this Area
Purchase History
| Date | Buyer | Sale Price | Title Company |
|---|---|---|---|
| Lecrenski Robert T | $203,000 | Chicago Title | |
| Sandwith Rex A | $138,000 | Chicago Title Ins Co | |
| Mcleod Colin D | $120,000 | -- | |
| Harrison James Cory | -- | -- |
Source: Public Records
Mortgage History
| Date | Status | Borrower | Loan Amount |
|---|---|---|---|
| Open | Lecrenski Robert T | $197,214 | |
| Previous Owner | Sandwith Rex A | $124,200 |
Source: Public Records
Tax History Compared to Growth
Tax History
| Year | Tax Paid | Tax Assessment Tax Assessment Total Assessment is a certain percentage of the fair market value that is determined by local assessors to be the total taxable value of land and additions on the property. | Land | Improvement |
|---|---|---|---|---|
| 2024 | $6,868 | $711,000 | $672,000 | $39,000 |
| 2023 | $6,498 | $595,000 | $560,000 | $35,000 |
| 2022 | $5,820 | $727,000 | $487,000 | $240,000 |
| 2021 | $5,392 | $529,000 | $356,000 | $173,000 |
| 2020 | $4,531 | $451,000 | $297,000 | $154,000 |
| 2018 | $3,863 | $382,000 | $280,000 | $102,000 |
| 2017 | $3,468 | $328,000 | $240,000 | $88,000 |
| 2016 | $3,262 | $298,000 | $220,000 | $78,000 |
| 2015 | $3,027 | $284,000 | $213,000 | $71,000 |
| 2014 | -- | $254,000 | $187,000 | $67,000 |
| 2013 | -- | $248,000 | $175,000 | $73,000 |
Source: Public Records
Map
Nearby Homes
- 9010 NE 203rd Ct Unit C
- 20347 90th Dr NE Unit B
- 20347 90th Dr NE Unit A
- 9008 NE 203rd Ln Unit A
- 9007 NE 203rd Ln Unit A
- 9007 NE 203rd Ln Unit D
- 9009 NE 203rd Ct Unit D
- 9017 NE 203rd Ct Unit C
- 20341 90th Dr NE Unit F
- 9016 NE 203rd Ct Unit B
- 20042 94th Ave NE
- 20403 94th NE
- 8516 NE 198th St
- 24327 13th Ave SE
- 24327 13th Ave SE Unit CR19
- 24323 13th Ave SE
- 24323 13th Ave SE Unit CR20
- 20101 95th Place NE
- 24319 13th Ave SE
- 8302 NE 203rd St
- 8857 NE 203rd Place
- 8845 NE 203rd Place
- 8846 NE 202nd Place
- 9014 NE 203rd Place Unit D
- 8840 NE 202nd Place
- 8835 NE 203rd Place
- 8852 NE 203rd Place
- 8844 NE 203rd Place
- 8832 NE 202nd Place
- 8860 NE 203rd Place
- 8827 NE 203rd Place
- 8836 NE 203rd Place
- 8826 NE 202nd Place
- 20329 89th (Lot 12) Ct NE
- 20328 89th (Lot 9) Ct NE
- 8828 NE 203rd Place
- 8819 NE 203rd Place
- 20324 NE 89th (Lot 10) Ct NE
- 20332 NE 89th (Lot 8) Ct NE
- 8822 NE 202nd Place