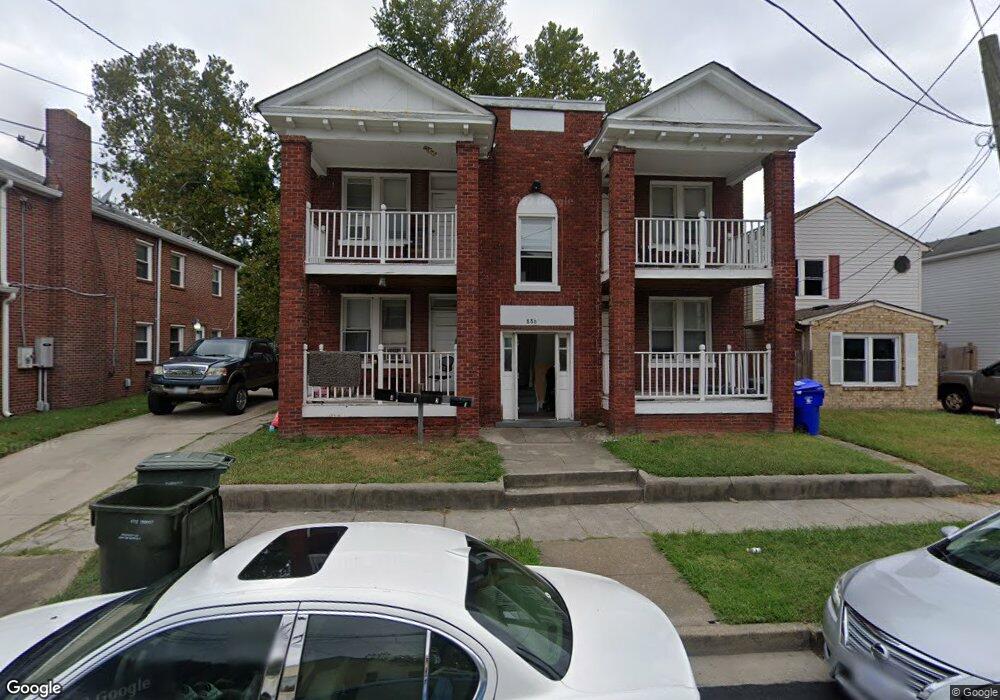
886 A Ave Norfolk, VA 23504
Olde Huntersville NeighborhoodEstimated Value: $339,000 - $370,000
2
Beds
1
Bath
3,924
Sq Ft
$90/Sq Ft
Est. Value
About This Home
This home is located at 886 A Ave, Norfolk, VA 23504 and is currently estimated at $354,000, approximately $90 per square foot. 886 A Ave is a home located in Norfolk City with nearby schools including Jacox Elementary School, Blair Middle School, and Granby High School.
Ownership History
Date
Name
Owned For
Owner Type
Purchase Details
Closed on
Mar 30, 2011
Sold by
Deutsche Bank National Trust Company
Bought by
Messi Llc
Current Estimated Value
Purchase Details
Closed on
Aug 31, 2010
Sold by
Siddiq Palwasha P
Bought by
Deutsche Bank National Trust Co
Purchase Details
Closed on
Jan 19, 2005
Sold by
Jones E Andre
Bought by
Siddiq Palwaha P
Home Financials for this Owner
Home Financials are based on the most recent Mortgage that was taken out on this home.
Original Mortgage
$180,200
Interest Rate
7.87%
Mortgage Type
Adjustable Rate Mortgage/ARM
Create a Home Valuation Report for This Property
The Home Valuation Report is an in-depth analysis detailing your home's value as well as a comparison with similar homes in the area
Home Values in the Area
Average Home Value in this Area
Purchase History
| Date | Buyer | Sale Price | Title Company |
|---|---|---|---|
| Messi Llc | $40,000 | Gemini Title & Escrow Llc | |
| Deutsche Bank National Trust Co | $135,267 | -- | |
| Siddiq Palwaha P | $212,000 | -- |
Source: Public Records
Mortgage History
| Date | Status | Borrower | Loan Amount |
|---|---|---|---|
| Previous Owner | Siddiq Palwaha P | $180,200 |
Source: Public Records
Tax History
| Year | Tax Paid | Tax Assessment Tax Assessment Total Assessment is a certain percentage of the fair market value that is determined by local assessors to be the total taxable value of land and additions on the property. | Land | Improvement |
|---|---|---|---|---|
| 2025 | $4,171 | $333,700 | $73,000 | $260,700 |
| 2024 | $3,860 | $313,800 | $73,000 | $240,800 |
| 2023 | $3,765 | $301,200 | $73,000 | $228,200 |
| 2022 | $3,248 | $259,800 | $50,400 | $209,400 |
| 2021 | $2,843 | $227,400 | $30,600 | $196,800 |
| 2020 | $2,843 | $227,400 | $30,600 | $196,800 |
| 2019 | $2,538 | $203,000 | $30,600 | $172,400 |
| 2018 | $2,439 | $195,100 | $30,600 | $164,500 |
| 2017 | $2,222 | $193,200 | $30,600 | $162,600 |
| 2016 | $2,177 | $193,100 | $30,600 | $162,500 |
| 2015 | $2,221 | $193,100 | $30,600 | $162,500 |
| 2014 | $2,221 | $193,100 | $30,600 | $162,500 |
Source: Public Records
Map
Nearby Homes
- 830 Fremont St Unit ABCD
- 942 Sutton St
- 857 B Ave
- 859 Lexington St
- 1004 Barney St
- 755 A Ave
- 823 Washington Ave
- 746 A Ave
- 765 C Ave
- 741 Washington Ave
- 714 Fremont St
- 904 Pollard St
- 1520 Church St
- 742 Johnson Ave
- 2406 Masi St
- 944 Gordon Ave
- 956 Gordon Ave
- 2655 Barre St
- 912 Lindenwood Ave
- 702 Howard Place
Your Personal Tour Guide
Ask me questions while you tour the home.