886 E Main St John Day, OR 97845
Estimated Value: $272,000 - $373,000
3
Beds
2
Baths
1,562
Sq Ft
$203/Sq Ft
Est. Value
About This Home
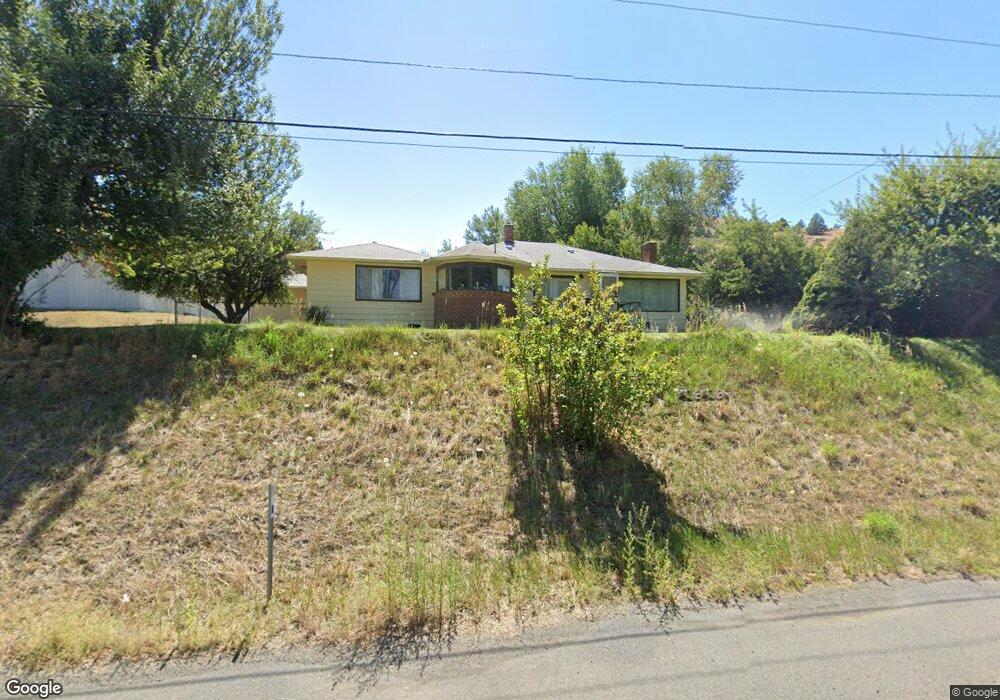
This home is located at 886 E Main St, John Day, OR 97845 and is currently estimated at $316,771, approximately $202 per square foot. 886 E Main St is a home located in Grant County with nearby schools including Grant Union Junior/Senior High School.
Ownership History
Date
Name
Owned For
Owner Type
Purchase Details
Closed on
Mar 25, 2009
Sold by
Penell Michael R
Bought by
Brockway Jodi L
Current Estimated Value
Home Financials for this Owner
Home Financials are based on the most recent Mortgage that was taken out on this home.
Original Mortgage
$170,095
Outstanding Balance
$117,661
Interest Rate
5.15%
Mortgage Type
Purchase Money Mortgage
Estimated Equity
$199,110
Create a Home Valuation Report for This Property
The Home Valuation Report is an in-depth analysis detailing your home's value as well as a comparison with similar homes in the area
Purchase History
| Date | Buyer | Sale Price | Title Company |
|---|---|---|---|
| Brockway Jodi L | $169,000 | None Available | |
| Brockway Jodi L | $169,000 | None Available |
Source: Public Records
Mortgage History
| Date | Status | Borrower | Loan Amount |
|---|---|---|---|
| Open | Brockway Jodi L | $170,095 | |
| Closed | Brockway Jodi L | $170,095 |
Source: Public Records
Tax History
| Year | Tax Paid | Tax Assessment Tax Assessment Total Assessment is a certain percentage of the fair market value that is determined by local assessors to be the total taxable value of land and additions on the property. | Land | Improvement |
|---|---|---|---|---|
| 2025 | $2,335 | $154,719 | $36,965 | $117,754 |
| 2024 | $2,270 | $150,213 | $35,888 | $114,325 |
| 2023 | $2,205 | $145,838 | $34,845 | $110,993 |
| 2022 | $2,143 | $141,591 | $33,832 | $107,759 |
| 2021 | $2,097 | $137,467 | $32,846 | $104,621 |
| 2020 | $2,198 | $133,464 | $31,886 | $101,578 |
| 2019 | $2,129 | $129,577 | $31,302 | $98,275 |
| 2018 | $2,075 | $125,803 | $30,394 | $95,409 |
| 2017 | $2,024 | $122,139 | $29,505 | $92,634 |
| 2016 | $1,967 | $118,582 | $28,646 | $89,936 |
| 2015 | $1,848 | $111,776 | $27,002 | $84,774 |
| 2014 | $1,848 | $111,776 | $27,002 | $84,774 |
| 2013 | $1,729 | $108,521 | $23,649 | $84,872 |
Source: Public Records
Map
Nearby Homes
- 858 E Main St
- 748 E Main St
- 633 SE Hillcrest Rd
- 518 SE 2nd Ave
- 100 SE Hillcrest Rd
- 801 Ferguson Rd
- 311 NE 7th Ave
- 250 NE Dayton St
- 173 N Canyon Blvd
- 755 S Canyon Blvd
- 839 S Canyon Blvd
- 0 NE 7th St
- 311 NE 7th St
- 0 Blue Gulch Rd
- 128 SW Canton St
- 242 NW 1st Ave
- 0 N Fork 40 Unit 21
- 410 NW Bridge St
- 213 NW 4th Ave
- 212 NW 5th Ave
Your Personal Tour Guide
Ask me questions while you tour the home.