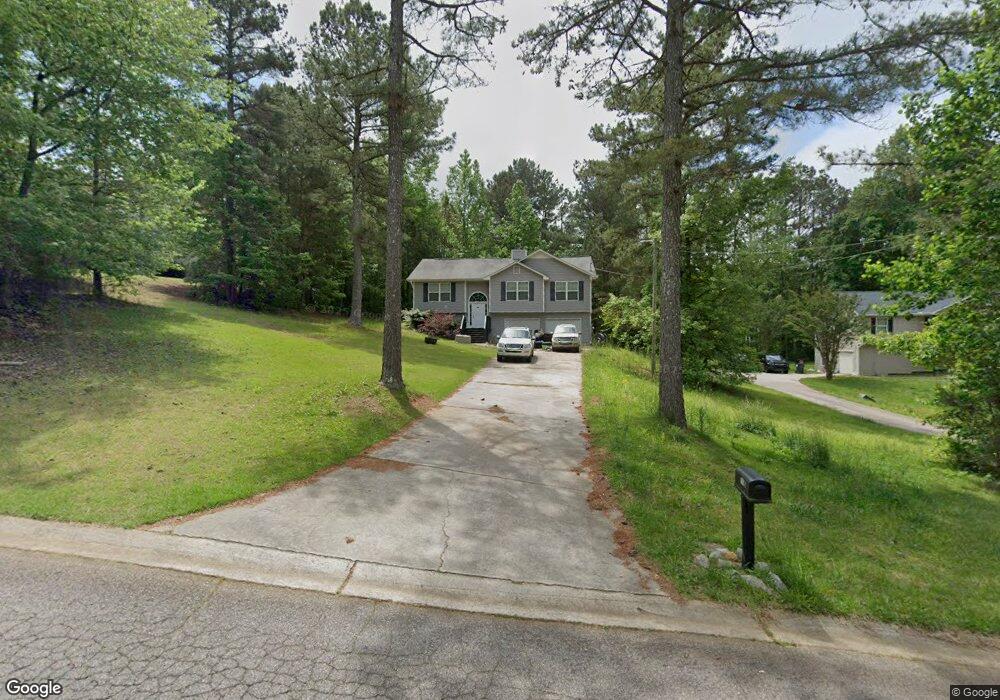
886 Eagles Nest Cir Carrollton, GA 30116
Estimated Value: $268,000 - $295,533
3
Beds
2
Baths
1,476
Sq Ft
$191/Sq Ft
Est. Value
About This Home
This home is located at 886 Eagles Nest Cir, Carrollton, GA 30116 and is currently estimated at $282,383, approximately $191 per square foot. 886 Eagles Nest Cir is a home located in Carroll County with nearby schools including Central Elementary School, Central Middle School, and Central High School.
Ownership History
Date
Name
Owned For
Owner Type
Purchase Details
Closed on
Dec 26, 2015
Sold by
Madry Charles
Bought by
Madry Charles and Madry Brenda
Current Estimated Value
Home Financials for this Owner
Home Financials are based on the most recent Mortgage that was taken out on this home.
Original Mortgage
$108,700
Outstanding Balance
$86,480
Interest Rate
3.97%
Mortgage Type
New Conventional
Estimated Equity
$195,903
Purchase Details
Closed on
Aug 19, 2005
Sold by
Madry Charlesrio Construct
Bought by
Madry Charles and Madry Cahrles Ryan
Home Financials for this Owner
Home Financials are based on the most recent Mortgage that was taken out on this home.
Original Mortgage
$106,150
Interest Rate
5.5%
Mortgage Type
New Conventional
Purchase Details
Closed on
Mar 18, 2004
Sold by
Mcdowell Dennis H
Bought by
Rio Construction & Investments Inc
Purchase Details
Closed on
Apr 28, 1999
Bought by
Mcdowell Dennis H
Create a Home Valuation Report for This Property
The Home Valuation Report is an in-depth analysis detailing your home's value as well as a comparison with similar homes in the area
Home Values in the Area
Average Home Value in this Area
Purchase History
| Date | Buyer | Sale Price | Title Company |
|---|---|---|---|
| Madry Charles | -- | -- | |
| Madry Charles | $132,700 | -- | |
| Rio Construction & Investments Inc | $20,000 | -- | |
| Mcdowell Dennis H | -- | -- |
Source: Public Records
Mortgage History
| Date | Status | Borrower | Loan Amount |
|---|---|---|---|
| Open | Madry Charles | $108,700 | |
| Previous Owner | Madry Charles | $106,150 | |
| Previous Owner | Madry Charles | $26,500 |
Source: Public Records
Tax History Compared to Growth
Tax History
| Year | Tax Paid | Tax Assessment Tax Assessment Total Assessment is a certain percentage of the fair market value that is determined by local assessors to be the total taxable value of land and additions on the property. | Land | Improvement |
|---|---|---|---|---|
| 2024 | $2,894 | $127,942 | $7,400 | $120,542 |
| 2023 | $2,894 | $117,005 | $7,400 | $109,605 |
| 2022 | $2,357 | $93,994 | $6,000 | $87,994 |
| 2021 | $2,085 | $81,315 | $6,000 | $75,315 |
| 2020 | $1,654 | $64,453 | $6,000 | $58,453 |
| 2019 | $1,554 | $60,032 | $6,000 | $54,032 |
| 2018 | $1,262 | $48,076 | $4,000 | $44,076 |
| 2017 | $1,266 | $48,076 | $4,000 | $44,076 |
| 2016 | $1,267 | $48,076 | $4,000 | $44,076 |
| 2015 | $1,114 | $39,845 | $4,000 | $35,846 |
| 2014 | $968 | $34,469 | $4,000 | $30,469 |
Source: Public Records
Map
Nearby Homes
- 892 Eagles Nest Cir
- 870 Eagles Nest Cir
- 870 Eagles Nest Cir
- 1090 Eagles Nest Cir
- 868 Eagles Nest Cir
- 1106 Eagles Nest Cir
- 1074 Eagles Nest Cir
- 893 Eagles Nest Cir
- 974 Eagles Nest Cir
- 1122 Eagles Nest Cir
- 871 Eagles Nest Cir
- 915 Eagles Nest Cir
- 852 Eagles Nest Cir
- 1056 Eagles Nest Cir
- 1136 Eagles Nest Cir
- 937 Eagles Nest Cir
- 846 Eagles Nest Cir
- 1148 Eagles Nest Cir
- 1105 Eagles Nest Cir
- 1089 Eagles Nest Cir