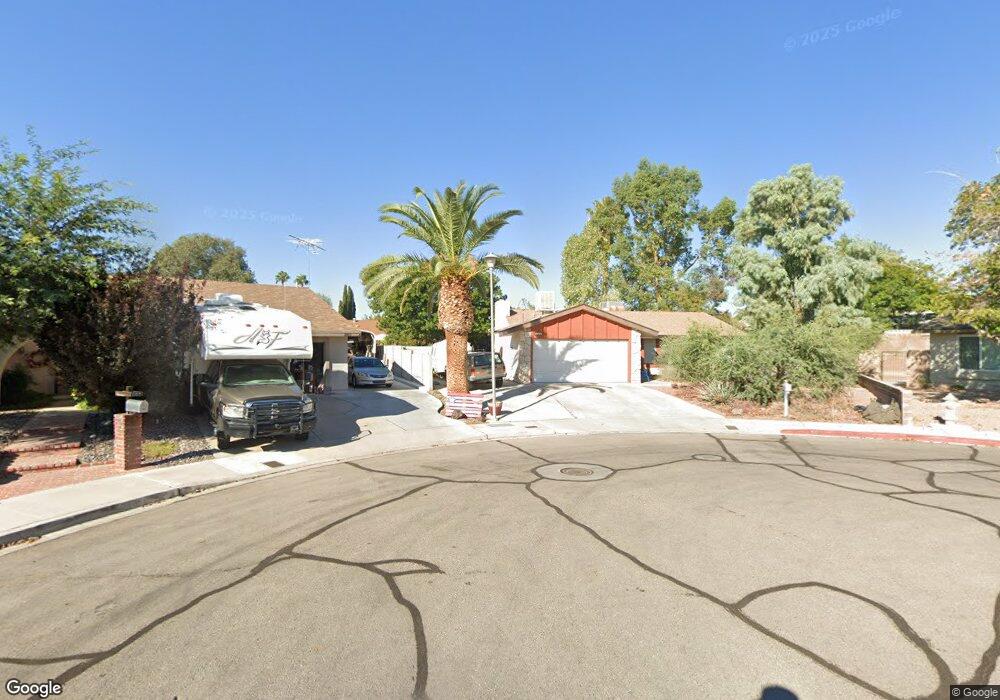
886 Marita Ct Boulder City, NV 89005
Estimated Value: $443,976 - $460,000
3
Beds
2
Baths
1,356
Sq Ft
$333/Sq Ft
Est. Value
About This Home
This home is located at 886 Marita Ct, Boulder City, NV 89005 and is currently estimated at $451,494, approximately $332 per square foot. 886 Marita Ct is a home located in Clark County with nearby schools including Andrew Mitchell Elementary School, Martha P. King Elementary School, and Elton M. & Madelaine E. Garrett Junior High School.
Ownership History
Date
Name
Owned For
Owner Type
Purchase Details
Closed on
Sep 16, 2008
Sold by
Parkis Sharon L and Parkis Steven E
Bought by
Parkis Steven E and Parkis Sharon L
Current Estimated Value
Purchase Details
Closed on
Sep 12, 1997
Sold by
Parkis William Hershel and Parkis Bettie Marie
Bought by
Parkis Steven E and Parkis Sharon L
Home Financials for this Owner
Home Financials are based on the most recent Mortgage that was taken out on this home.
Original Mortgage
$40,000
Outstanding Balance
$6,128
Interest Rate
7.34%
Estimated Equity
$445,366
Purchase Details
Closed on
Nov 29, 1994
Sold by
Freeland Dirk H
Bought by
Parkis William Hershel and Parkis Bettie Marie
Home Financials for this Owner
Home Financials are based on the most recent Mortgage that was taken out on this home.
Original Mortgage
$72,500
Interest Rate
9.08%
Create a Home Valuation Report for This Property
The Home Valuation Report is an in-depth analysis detailing your home's value as well as a comparison with similar homes in the area
Home Values in the Area
Average Home Value in this Area
Purchase History
| Date | Buyer | Sale Price | Title Company |
|---|---|---|---|
| Parkis Steven E | -- | None Available | |
| Parkis Steven E | $70,000 | Nevada Title Company | |
| Parkis William Hershel | $145,000 | United Title |
Source: Public Records
Mortgage History
| Date | Status | Borrower | Loan Amount |
|---|---|---|---|
| Open | Parkis Steven E | $40,000 | |
| Closed | Parkis William Hershel | $72,500 |
Source: Public Records
Tax History Compared to Growth
Tax History
| Year | Tax Paid | Tax Assessment Tax Assessment Total Assessment is a certain percentage of the fair market value that is determined by local assessors to be the total taxable value of land and additions on the property. | Land | Improvement |
|---|---|---|---|---|
| 2025 | $1,285 | $74,863 | $51,800 | $23,063 |
| 2024 | $1,247 | $74,863 | $51,800 | $23,063 |
| 2023 | $1,247 | $63,068 | $39,900 | $23,168 |
| 2022 | $1,215 | $56,781 | $35,000 | $21,781 |
| 2021 | $1,258 | $51,680 | $30,450 | $21,230 |
| 2020 | $1,146 | $52,020 | $30,450 | $21,570 |
| 2019 | $1,133 | $47,975 | $26,250 | $21,725 |
| 2018 | $1,081 | $44,451 | $23,100 | $21,351 |
| 2017 | $1,101 | $44,819 | $22,750 | $22,069 |
| 2016 | $1,009 | $43,212 | $20,300 | $22,912 |
| 2015 | $1,008 | $40,523 | $17,500 | $23,023 |
| 2014 | $979 | $39,101 | $15,750 | $23,351 |
Source: Public Records
Map
Nearby Homes
- 976 El Camino Way
- 1511 Irene Dr
- 782 Sandra Dr
- 1321 Nadine Way
- 839 Benita Place
- 1527 Irene Dr
- 834 Benita Place
- 873 Montera Ln
- 776 San Remo Way
- 1316 Capri Dr Unit A,B,C,&D
- 855 Del Rey Dr
- 1303 Darlene Way Unit 105C
- 1303 Darlene Way Unit 102B
- 1000 Legacy Dr
- 1437 Cattail Falls St
- 1505 Carlsbad St
- 1414 Cattail Falls St
- 893 Fairway Dr
- 798 Fairway Dr
- 1010 Legacy Dr
- 888 Marita Ct
- 887 Marita Ct
- 1409 Gloria Ln
- 1413 Gloria Ln
- 1407 Gloria Ln
- 890 Marita Ct
- 889 Marita Ct
- 1404 Marita Dr
- 1415 Gloria Ln
- 1405 Gloria Ln
- 891 Marita Ct
- 896 El Camino Way
- 894 El Camino Way
- 1402 Marita Dr Unit 1
- 1417 Gloria Ln
- 892 El Camino Way
- 1410 Gloria Ln
- 1408 Gloria Ln
- 1403 Gloria Ln
- 1412 Gloria Ln