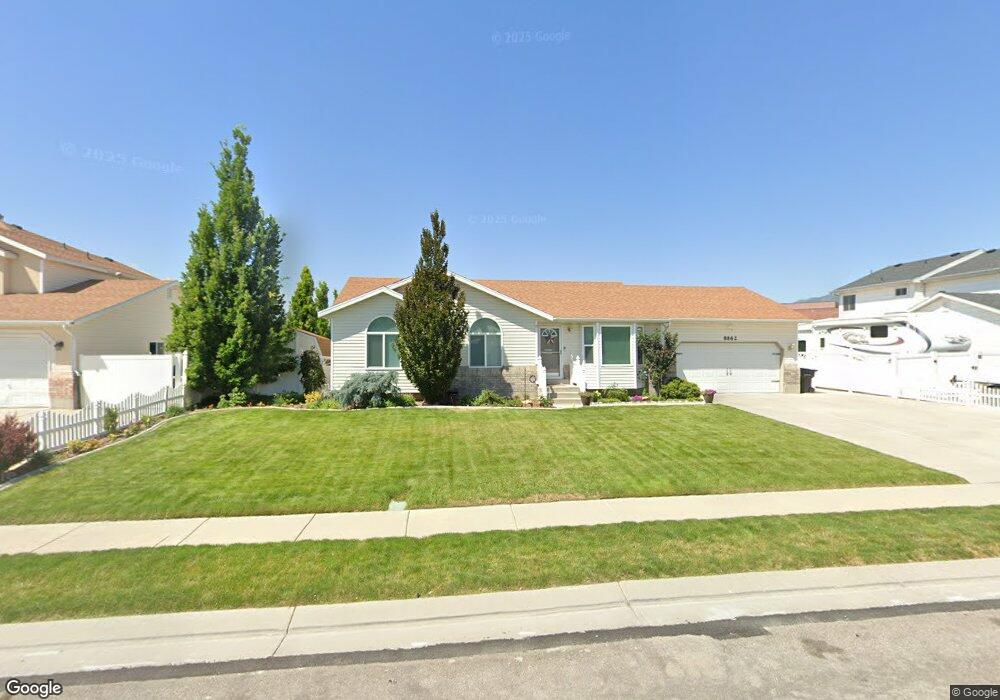
8862 S Aspen View Dr West Jordan, UT 84081
Copper Hills NeighborhoodEstimated Value: $575,000 - $634,000
8
Beds
3
Baths
2,580
Sq Ft
$234/Sq Ft
Est. Value
About This Home
This home is located at 8862 S Aspen View Dr, West Jordan, UT 84081 and is currently estimated at $604,370, approximately $234 per square foot. 8862 S Aspen View Dr is a home located in Salt Lake County with nearby schools including Copper Canyon School, West Hills Middle School, and Copper Hills High School.
Ownership History
Date
Name
Owned For
Owner Type
Purchase Details
Closed on
Jul 19, 2013
Sold by
Baker Troy and Baker Patricia J
Bought by
Fletcher Eric C
Current Estimated Value
Home Financials for this Owner
Home Financials are based on the most recent Mortgage that was taken out on this home.
Original Mortgage
$200,000
Outstanding Balance
$145,798
Interest Rate
3.98%
Mortgage Type
New Conventional
Estimated Equity
$458,572
Purchase Details
Closed on
Feb 2, 2006
Sold by
Martin Dean H and Martin Laurie E
Bought by
Baker Troy and Baker Patricia J
Home Financials for this Owner
Home Financials are based on the most recent Mortgage that was taken out on this home.
Original Mortgage
$33,840
Interest Rate
6.16%
Mortgage Type
Stand Alone Second
Purchase Details
Closed on
Feb 25, 1999
Sold by
Glen R Pettit Inc
Bought by
Martin Dean H and Martin Laurie E
Home Financials for this Owner
Home Financials are based on the most recent Mortgage that was taken out on this home.
Original Mortgage
$136,800
Interest Rate
6.78%
Create a Home Valuation Report for This Property
The Home Valuation Report is an in-depth analysis detailing your home's value as well as a comparison with similar homes in the area
Home Values in the Area
Average Home Value in this Area
Purchase History
| Date | Buyer | Sale Price | Title Company |
|---|---|---|---|
| Fletcher Eric C | -- | Meridian Title | |
| Baker Troy | -- | First American Title | |
| Martin Dean H | -- | Merrill Title |
Source: Public Records
Mortgage History
| Date | Status | Borrower | Loan Amount |
|---|---|---|---|
| Open | Fletcher Eric C | $200,000 | |
| Previous Owner | Baker Troy | $33,840 | |
| Previous Owner | Baker Troy | $180,480 | |
| Previous Owner | Martin Dean H | $136,800 |
Source: Public Records
Tax History Compared to Growth
Tax History
| Year | Tax Paid | Tax Assessment Tax Assessment Total Assessment is a certain percentage of the fair market value that is determined by local assessors to be the total taxable value of land and additions on the property. | Land | Improvement |
|---|---|---|---|---|
| 2025 | $2,939 | $569,800 | $169,300 | $400,500 |
| 2024 | $2,939 | $565,400 | $167,600 | $397,800 |
| 2023 | $2,955 | $535,800 | $158,100 | $377,700 |
| 2022 | $2,950 | $526,300 | $155,000 | $371,300 |
| 2021 | $2,485 | $403,600 | $120,500 | $283,100 |
| 2020 | $2,327 | $354,700 | $120,500 | $234,200 |
| 2019 | $2,293 | $342,700 | $113,700 | $229,000 |
| 2018 | $2,172 | $321,900 | $113,700 | $208,200 |
| 2017 | $2,045 | $301,800 | $113,700 | $188,100 |
| 2016 | $1,976 | $274,000 | $113,700 | $160,300 |
| 2015 | $2,130 | $288,000 | $120,200 | $167,800 |
| 2014 | $1,968 | $261,900 | $110,500 | $151,400 |
Source: Public Records
Map
Nearby Homes
- 8854 Rocky Creek Dr
- 8793 S Big Bar Ct
- 5582 Washoe Cove
- 9118 S Wisteria Way
- 5098 Cherry Laurel Ln
- 9182 Wisteria Way
- 8577 Autumn Gold Cir
- 8453 S Windmill Dr
- 8441 S Spratling Dr
- 4887 W 8620 S
- 9332 S Wild Clover Ln
- 4904 Wild Acres Dr
- 8322 Copper Vista Cir
- 5746 W Swift Creek Rd
- 8501 S Michele River Ave
- 8501 S Michele River Ave Unit 116
- 5946 W Eric Mountain Ln Unit 103
- 5946 W Eric Mountain Ln
- 5958 W Eric Mountain Ln
- 5958 W Eric Mountain Ln Unit 104
- 8872 S Aspen View Dr
- 8848 S Aspen View Dr
- 8859 S Aspen View Dr
- 8836 S Aspen View Dr
- 8884 S Aspen View Dr
- 8847 S Aspen View Dr
- 8869 S Aspen View Dr
- 8835 S Aspen View Dr
- 8881 S Aspen View Dr
- 8881 S Aspen View Dr Unit 4
- 8881 Aspen View Dr W
- 8826 S Aspen View Dr
- 8896 S Aspen View Dr
- 8838 Rocky Creek Dr
- 8826 S Rocky Creek Dr
- 8826 Rocky Creek Dr
- 8854 S Rocky Creek Dr
- 5406 Pilgrim Dr
- 8823 S Aspen View Dr
- 8893 S Aspen View Dr