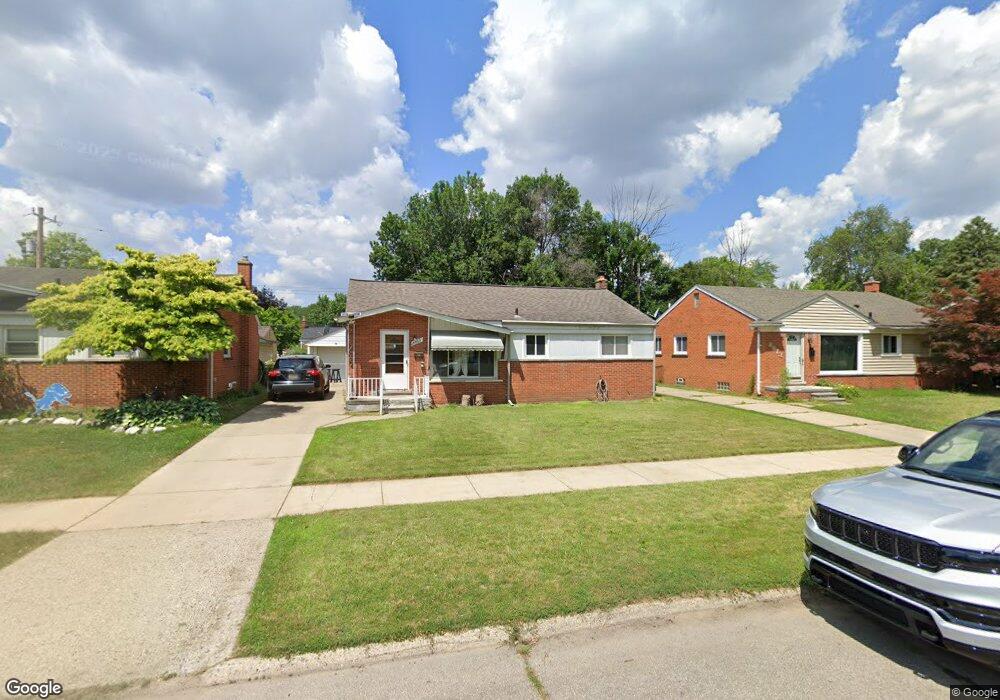
8863 Dixie Redford, MI 48239
Estimated Value: $121,244 - $216,000
3
Beds
2
Baths
1,083
Sq Ft
$159/Sq Ft
Est. Value
About This Home
This home is located at 8863 Dixie, Redford, MI 48239 and is currently estimated at $171,811, approximately $158 per square foot. 8863 Dixie is a home located in Wayne County with nearby schools including John D. Pierce Middle School, Lee M. Thurston High School, and Global Heights Academy.
Ownership History
Date
Name
Owned For
Owner Type
Purchase Details
Closed on
Aug 16, 2022
Sold by
Nguyen Lam Tim and Thi Nguyen Le Hoa
Bought by
Nguyen Huong and Danh Son Hong
Current Estimated Value
Purchase Details
Closed on
May 20, 2013
Sold by
Nguyen Lam Tim and Nguyen Lam
Bought by
Nguyen Lam Tim and Thi Nguyen Le Hoa
Purchase Details
Closed on
Nov 4, 2010
Sold by
Dziak Robert A
Bought by
Federal National Mortgage Association
Purchase Details
Closed on
Apr 12, 2002
Sold by
Peterson Charlotte
Bought by
Dziak Robert
Create a Home Valuation Report for This Property
The Home Valuation Report is an in-depth analysis detailing your home's value as well as a comparison with similar homes in the area
Home Values in the Area
Average Home Value in this Area
Purchase History
| Date | Buyer | Sale Price | Title Company |
|---|---|---|---|
| Nguyen Huong | $120,000 | Reputation First Title | |
| Nguyen Huong | $120,000 | Reputation First Title | |
| Nguyen Huong | -- | Reputation First Title | |
| Nguyen Lam Tim | -- | None Available | |
| Federal National Mortgage Association | $124,302 | None Available | |
| Dziak Robert | $129,500 | -- |
Source: Public Records
Mortgage History
| Date | Status | Borrower | Loan Amount |
|---|---|---|---|
| Closed | Dziak Robert | -- |
Source: Public Records
Tax History Compared to Growth
Tax History
| Year | Tax Paid | Tax Assessment Tax Assessment Total Assessment is a certain percentage of the fair market value that is determined by local assessors to be the total taxable value of land and additions on the property. | Land | Improvement |
|---|---|---|---|---|
| 2025 | $1,738 | $90,800 | $0 | $0 |
| 2024 | $1,738 | $83,800 | $0 | $0 |
| 2023 | $1,664 | $74,600 | $0 | $0 |
| 2022 | $2,437 | $66,000 | $0 | $0 |
| 2021 | $2,642 | $62,400 | $0 | $0 |
| 2020 | $2,606 | $53,700 | $0 | $0 |
| 2019 | $2,552 | $47,400 | $0 | $0 |
| 2018 | $919 | $38,800 | $0 | $0 |
| 2017 | $2,787 | $36,300 | $0 | $0 |
| 2016 | $2,280 | $37,000 | $0 | $0 |
| 2015 | $2,766 | $33,600 | $0 | $0 |
| 2013 | $2,680 | $27,300 | $0 | $0 |
| 2012 | $1,630 | $30,000 | $7,700 | $22,300 |
Source: Public Records
Map
Nearby Homes