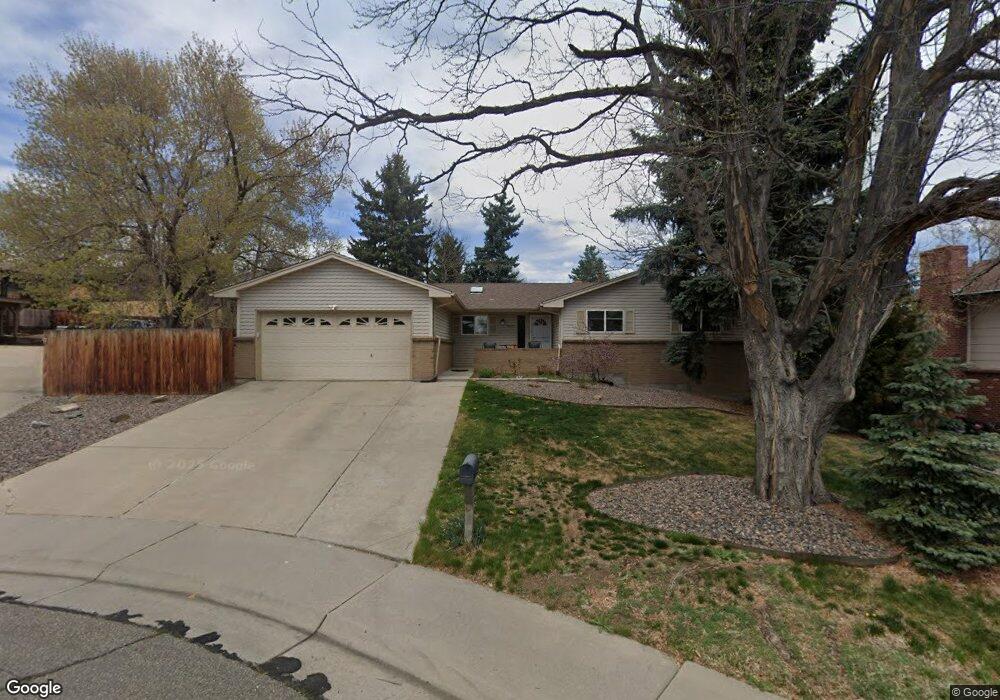
8863 W 64th Way Arvada, CO 80004
Scenic Heights NeighborhoodEstimated Value: $710,409 - $765,000
4
Beds
3
Baths
3,130
Sq Ft
$236/Sq Ft
Est. Value
About This Home
This home is located at 8863 W 64th Way, Arvada, CO 80004 and is currently estimated at $739,602, approximately $236 per square foot. 8863 W 64th Way is a home located in Jefferson County with nearby schools including Secrest Elementary School, North Arvada Middle School, and Arvada High School.
Ownership History
Date
Name
Owned For
Owner Type
Purchase Details
Closed on
Oct 22, 2020
Sold by
Robinson Landon S
Bought by
Crabtree Jeremy and Crabtree Landyn
Current Estimated Value
Home Financials for this Owner
Home Financials are based on the most recent Mortgage that was taken out on this home.
Original Mortgage
$387,500
Outstanding Balance
$344,032
Interest Rate
2.8%
Mortgage Type
New Conventional
Estimated Equity
$395,570
Purchase Details
Closed on
Apr 1, 2002
Sold by
Dahlinger Sharon M
Bought by
Robinson Landon S
Home Financials for this Owner
Home Financials are based on the most recent Mortgage that was taken out on this home.
Original Mortgage
$242,500
Interest Rate
5.87%
Purchase Details
Closed on
Sep 30, 1996
Sold by
Gibler Raymond S and Rhondae Gibler
Bought by
Dahlinger Sharon M
Home Financials for this Owner
Home Financials are based on the most recent Mortgage that was taken out on this home.
Original Mortgage
$30,000
Interest Rate
7.96%
Create a Home Valuation Report for This Property
The Home Valuation Report is an in-depth analysis detailing your home's value as well as a comparison with similar homes in the area
Home Values in the Area
Average Home Value in this Area
Purchase History
| Date | Buyer | Sale Price | Title Company |
|---|---|---|---|
| Crabtree Jeremy | $537,500 | Land Title Guarantee Co | |
| Robinson Landon S | $262,500 | First American Heritage Titl | |
| Dahlinger Sharon M | $167,000 | -- |
Source: Public Records
Mortgage History
| Date | Status | Borrower | Loan Amount |
|---|---|---|---|
| Open | Crabtree Jeremy | $387,500 | |
| Previous Owner | Robinson Landon S | $242,500 | |
| Previous Owner | Dahlinger Sharon M | $30,000 |
Source: Public Records
Tax History
| Year | Tax Paid | Tax Assessment Tax Assessment Total Assessment is a certain percentage of the fair market value that is determined by local assessors to be the total taxable value of land and additions on the property. | Land | Improvement |
|---|---|---|---|---|
| 2024 | $3,997 | $41,211 | $17,550 | $23,661 |
| 2023 | $3,997 | $41,211 | $17,550 | $23,661 |
| 2022 | $3,281 | $33,503 | $13,798 | $19,705 |
| 2021 | $3,335 | $34,467 | $14,195 | $20,272 |
| 2020 | $2,793 | $28,942 | $10,095 | $18,847 |
| 2019 | $2,755 | $28,942 | $10,095 | $18,847 |
| 2018 | $2,861 | $29,224 | $8,869 | $20,355 |
| 2017 | $2,619 | $29,224 | $8,869 | $20,355 |
| 2016 | $2,408 | $25,307 | $6,092 | $19,215 |
| 2015 | $2,158 | $25,307 | $6,092 | $19,215 |
| 2014 | $2,158 | $21,317 | $5,158 | $16,159 |
Source: Public Records
Map
Nearby Homes
- 9015 W 63rd Ave
- 8601 W 64th Place
- 6240 Everett Ct Unit B
- 8644 W 66th Cir
- 8401 W 64th Place
- 9142 Oberon Rd
- 8940 Cole Dr
- 9303 W 66th Place
- 6175 Dover St
- 8233 W 62nd Place
- 8410 Alta Vista Dr
- 8202 W 67th Dr
- 8612 W 69th Place
- 8225 W 67th Place
- 9656 Rensselaer Dr
- 6966 Dudley Dr
- 6806 Brentwood St
- 6077 Flower St
- 6150 Carr St
- 6075 Garrison St
- 8833 W 64th Way
- 8898 W 65th Ave
- 8893 W 64th Way
- 8928 W 65th Ave
- 8858 W 65th Ave
- 6513 Estes St
- 6493 Everett St
- 6474 Everett St
- 8968 W 65th Ave
- 6515 Estes St
- 8885 W 64th Place
- 8812 W 64th Way
- 6480 Field St
- 6454 Everett St
- 6490 Field St
- 8871 W 65th Ave
- 6425 Estes St
- 6507 Everett St
- 8999 W 64th Place
- 6512 Estes St
Your Personal Tour Guide
Ask me questions while you tour the home.