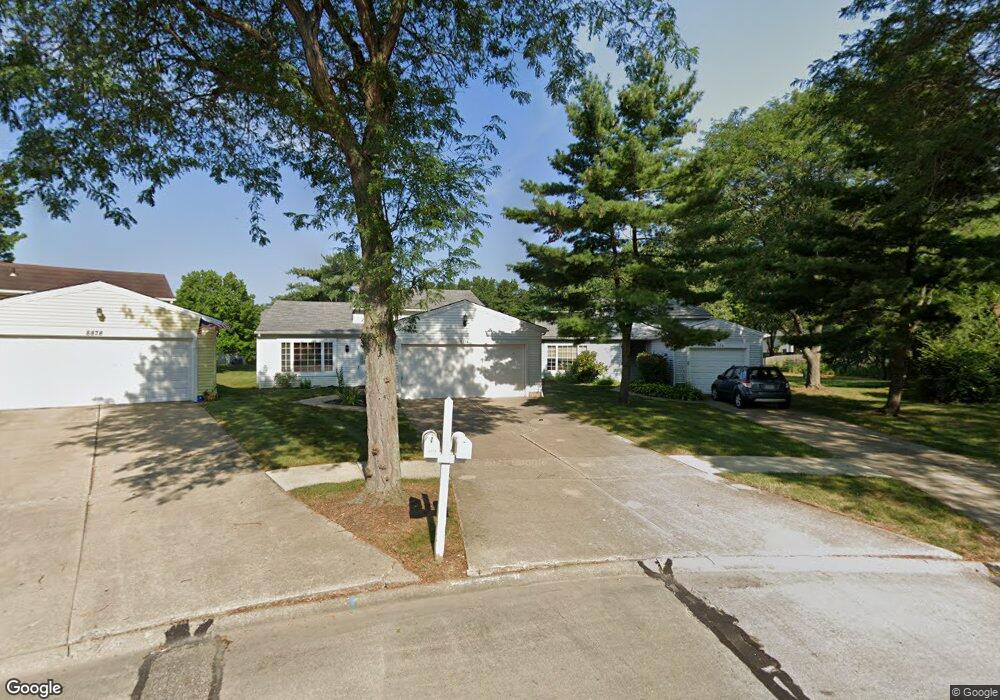
8866 Summerset Ln Olmsted Falls, OH 44138
Estimated Value: $203,000 - $229,000
3
Beds
2
Baths
1,520
Sq Ft
$142/Sq Ft
Est. Value
About This Home
This home is located at 8866 Summerset Ln, Olmsted Falls, OH 44138 and is currently estimated at $215,100, approximately $141 per square foot. 8866 Summerset Ln is a home located in Cuyahoga County with nearby schools including Falls-Lenox Primary Elementary School, Olmsted Falls Intermediate Building, and Olmsted Falls Middle School.
Ownership History
Date
Name
Owned For
Owner Type
Purchase Details
Closed on
Jun 27, 1996
Sold by
Mullins Janice K
Bought by
Ward Kirk
Current Estimated Value
Home Financials for this Owner
Home Financials are based on the most recent Mortgage that was taken out on this home.
Original Mortgage
$82,800
Outstanding Balance
$5,928
Interest Rate
8.13%
Mortgage Type
New Conventional
Estimated Equity
$209,172
Purchase Details
Closed on
Jan 31, 1995
Sold by
Debnar Sandra L
Bought by
Mullins Janice K
Home Financials for this Owner
Home Financials are based on the most recent Mortgage that was taken out on this home.
Original Mortgage
$84,600
Interest Rate
5.88%
Mortgage Type
New Conventional
Purchase Details
Closed on
Jan 2, 1992
Sold by
Ferrell Jonathan L
Bought by
Debnar Timothy
Purchase Details
Closed on
Apr 26, 1984
Bought by
Ferrell Jonathan L
Purchase Details
Closed on
Jan 1, 1982
Bought by
Flair Bldrs Inc
Create a Home Valuation Report for This Property
The Home Valuation Report is an in-depth analysis detailing your home's value as well as a comparison with similar homes in the area
Home Values in the Area
Average Home Value in this Area
Purchase History
| Date | Buyer | Sale Price | Title Company |
|---|---|---|---|
| Ward Kirk | $103,500 | -- | |
| Mullins Janice K | $94,000 | -- | |
| Debnar Timothy | $83,500 | -- | |
| Ferrell Jonathan L | -- | -- | |
| Flair Bldrs Inc | -- | -- |
Source: Public Records
Mortgage History
| Date | Status | Borrower | Loan Amount |
|---|---|---|---|
| Open | Ward Kirk | $82,800 | |
| Previous Owner | Mullins Janice K | $84,600 |
Source: Public Records
Tax History Compared to Growth
Tax History
| Year | Tax Paid | Tax Assessment Tax Assessment Total Assessment is a certain percentage of the fair market value that is determined by local assessors to be the total taxable value of land and additions on the property. | Land | Improvement |
|---|---|---|---|---|
| 2024 | $3,997 | $59,990 | $5,985 | $54,005 |
| 2023 | $3,865 | $47,640 | $4,760 | $42,880 |
| 2022 | $3,827 | $47,635 | $4,760 | $42,875 |
| 2021 | $3,788 | $47,640 | $4,760 | $42,880 |
| 2020 | $3,355 | $37,210 | $3,710 | $33,500 |
| 2019 | $2,979 | $106,300 | $10,600 | $95,700 |
| 2018 | $2,908 | $37,210 | $3,710 | $33,500 |
| 2017 | $2,822 | $32,420 | $3,260 | $29,160 |
| 2016 | $2,806 | $32,420 | $3,260 | $29,160 |
| 2015 | $3,337 | $32,420 | $3,260 | $29,160 |
| 2014 | $3,337 | $36,020 | $3,610 | $32,410 |
Source: Public Records
Map
Nearby Homes
- 26179 Raintree Blvd Unit D8
- 26187 Raintree Blvd Unit C5
- 26183 Raintree Blvd Unit C-10
- 9947 Magnolia Dr Unit 14
- 26523 Sussex Dr
- 26511 Locust Dr
- 26609 N Park Blvd Unit 26609
- 9190 Waterfall Dr
- 9180 Waterfall Dr
- 9430 Columbia Rd
- 31100 Blooming Ln
- 26508 Redwood Dr
- 26700 Redwood Dr
- 26645 Lake of the Falls Blvd
- Caroline Plan at Falls Landing - Villas
- Wexford Plan at Falls Landing - Villas
- Rosecliff Plan at Falls Landing - Villas
- V/L Usher Rd
- 9159 E Windsor Dr
- Anderson Plan at Smokestack Trails
- 8887 Summerset Ln Unit 116
- 8887 Summerset Ln
- 8875 Summerset Ln Unit 119
- 8887 Summerset Ln
- 8866 Summerset Ln Unit 120
- 8874 Summerset Ln
- 8874 Summerset Ln Unit 12
- 8874 Summerset Ln Unit 122
- 8878 Summerset Ln Unit 123
- 8882 Summerset Ln Unit 124
- 8886 Summerset Ln Unit 125
- 6691 Laurel Ln Unit 137
- 8890 Summerset Ln Unit 126
- 6695 Laurel Ln Unit 136
- 6687 Laurel Ln Unit 138
- 6699 Laurel Ln Unit 135
- 6683 Laurel Ln Unit 139
- 8883 Summerset Ln Unit 117
- 8883 Summerset Ln Unit 1
- 6679 Laurel Ln