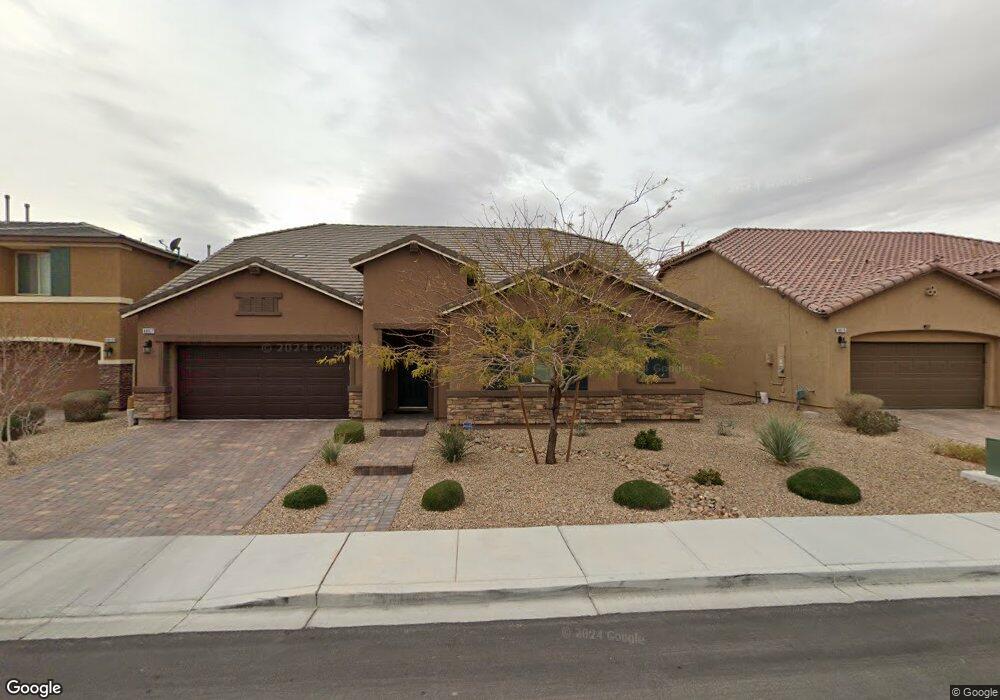
8867 Pauley Hills St Las Vegas, NV 89131
Tule Springs NeighborhoodEstimated Value: $659,000 - $779,000
3
Beds
3
Baths
3,647
Sq Ft
$196/Sq Ft
Est. Value
About This Home
This home is located at 8867 Pauley Hills St, Las Vegas, NV 89131 and is currently estimated at $716,529, approximately $196 per square foot. 8867 Pauley Hills St is a home with nearby schools including Kitty Mcdonough Ward Elementary School, Anthony Saville Middle School, and Shadow Ridge High School.
Ownership History
Date
Name
Owned For
Owner Type
Purchase Details
Closed on
Jul 23, 2021
Sold by
Shoemaker James
Bought by
Shoemaker Tianna
Current Estimated Value
Home Financials for this Owner
Home Financials are based on the most recent Mortgage that was taken out on this home.
Original Mortgage
$420,000
Outstanding Balance
$381,260
Interest Rate
2.93%
Mortgage Type
New Conventional
Estimated Equity
$335,269
Purchase Details
Closed on
Apr 17, 2017
Sold by
Shoemaker James
Bought by
Shoemaker Tianna
Home Financials for this Owner
Home Financials are based on the most recent Mortgage that was taken out on this home.
Original Mortgage
$339,038
Interest Rate
4.1%
Mortgage Type
New Conventional
Purchase Details
Closed on
Apr 14, 2017
Sold by
Richmond American Homes Of Nevada Inc
Bought by
Shoemaker Tianna
Home Financials for this Owner
Home Financials are based on the most recent Mortgage that was taken out on this home.
Original Mortgage
$339,038
Interest Rate
4.1%
Mortgage Type
New Conventional
Create a Home Valuation Report for This Property
The Home Valuation Report is an in-depth analysis detailing your home's value as well as a comparison with similar homes in the area
Home Values in the Area
Average Home Value in this Area
Purchase History
| Date | Buyer | Sale Price | Title Company |
|---|---|---|---|
| Shoemaker Tianna | -- | Lawyers Title Of Nevada | |
| Shoemaker Tianna | -- | Ticor Title Las Vegas | |
| Shoemaker Tianna | $376,709 | Ticor Title Of Nevada Inc |
Source: Public Records
Mortgage History
| Date | Status | Borrower | Loan Amount |
|---|---|---|---|
| Open | Shoemaker Tianna | $420,000 | |
| Closed | Shoemaker Tianna | $339,038 |
Source: Public Records
Tax History Compared to Growth
Tax History
| Year | Tax Paid | Tax Assessment Tax Assessment Total Assessment is a certain percentage of the fair market value that is determined by local assessors to be the total taxable value of land and additions on the property. | Land | Improvement |
|---|---|---|---|---|
| 2025 | $5,095 | $208,264 | $50,750 | $157,514 |
| 2024 | $4,947 | $208,264 | $50,750 | $157,514 |
| 2023 | $634 | $210,815 | $51,800 | $159,015 |
| 2022 | $4,804 | $186,876 | $43,050 | $143,826 |
| 2021 | $4,664 | $159,985 | $37,450 | $122,535 |
| 2020 | $4,525 | $153,020 | $37,450 | $115,570 |
| 2019 | $4,393 | $153,495 | $33,600 | $119,895 |
| 2018 | $4,265 | $130,106 | $27,650 | $102,456 |
| 2017 | $883 | $26,950 | $26,950 | $0 |
| 2016 | $634 | $19,250 | $19,250 | $0 |
| 2015 | $631 | $0 | $0 | $0 |
Source: Public Records
Map
Nearby Homes
- 5614 Sophie Belle Ave
- 8885 Kenzie Cove St
- 5713 Silver Cascade Ave
- 8828 Monte Oro Dr
- 5805 Cabo San Lucas Ave
- 8723 Melissa Meadows St
- 5324 Fireside Ranch Ave
- 5316 Fireside Ranch Ave
- 5305 Fireside Ranch Ave
- 5834 Toofer Winds Ct Unit 1
- 5545 Old Stable Ave
- 5912 Kit Cove Ct
- 8708 Palomino Ranch St
- 6009 Jalisco Ave
- 5321 Welch Valley Ave
- 5808 Amber Station Ave
- 9109 Costa de Oro Ct
- 5820 Amber Station Ave
- 8630 Lavender Ridge St
- 8512 Canyon Ranch St
- 8859 Pauley Hills St
- 8875 Pauley Hills St
- 8876 Nolene Stream St
- 8868 Nolene Stream St
- 8851 Pauley Hills St
- 8860 Nolene Stream St
- 5535 Bruin Lakes St
- 5536 Bruin Lakes St
- 8843 Pauley Hills St
- 8852 Nolene Stream St
- 5532 Bruin Lakes St
- 5600 Honey Creek Ave
- 5531 Bruin Lakes St
- 5580 Honey Creek Ave
- 8920 Sable Falls St
- 8844 Nolene Stream St
- 8842 Pauley Hills St
- 8835 Pauley Hills St
- 5528 Bruin Lakes St
- 5570 Honey Creek Ave