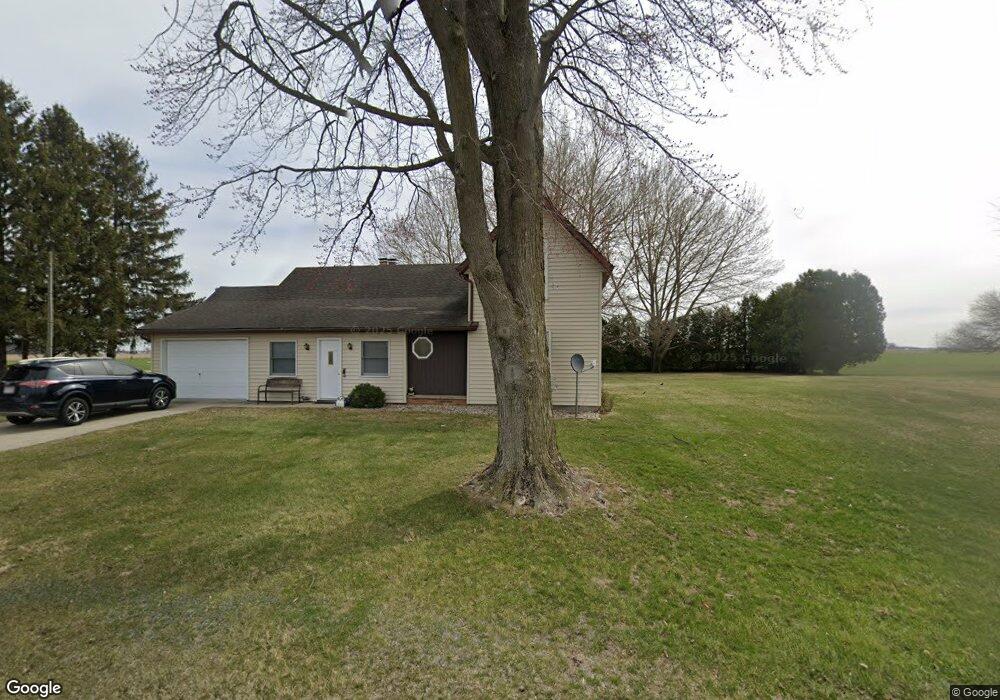
8869 Road 4 Leipsic, OH 45856
Estimated Value: $225,699 - $268,000
3
Beds
1
Bath
2,592
Sq Ft
$93/Sq Ft
Est. Value
About This Home
This home is located at 8869 Road 4, Leipsic, OH 45856 and is currently estimated at $239,925, approximately $92 per square foot. 8869 Road 4 is a home located in Putnam County with nearby schools including Pandora-Gilboa Elementary School, Pandora-Gilboa Middle School, and Pandora-Gilboa High School.
Ownership History
Date
Name
Owned For
Owner Type
Purchase Details
Closed on
Apr 29, 2016
Sold by
Hartley Jane E
Bought by
Hittle Ryan W
Current Estimated Value
Home Financials for this Owner
Home Financials are based on the most recent Mortgage that was taken out on this home.
Original Mortgage
$125,300
Outstanding Balance
$98,625
Interest Rate
3.73%
Mortgage Type
New Conventional
Estimated Equity
$141,300
Purchase Details
Closed on
Mar 11, 2002
Bought by
Hartley Jane E
Create a Home Valuation Report for This Property
The Home Valuation Report is an in-depth analysis detailing your home's value as well as a comparison with similar homes in the area
Purchase History
| Date | Buyer | Sale Price | Title Company |
|---|---|---|---|
| Hittle Ryan W | $131,900 | Attorney | |
| Hartley Jane E | -- | -- |
Source: Public Records
Mortgage History
| Date | Status | Borrower | Loan Amount |
|---|---|---|---|
| Open | Hittle Ryan W | $125,300 |
Source: Public Records
Tax History
| Year | Tax Paid | Tax Assessment Tax Assessment Total Assessment is a certain percentage of the fair market value that is determined by local assessors to be the total taxable value of land and additions on the property. | Land | Improvement |
|---|---|---|---|---|
| 2025 | $1,690 | $57,100 | $6,300 | $50,800 |
| 2024 | $1,645 | $57,100 | $6,300 | $50,800 |
| 2023 | $1,700 | $43,380 | $4,870 | $38,510 |
| 2022 | $1,711 | $43,380 | $4,869 | $38,511 |
| 2021 | $1,715 | $43,380 | $4,869 | $38,511 |
| 2020 | $1,719 | $29,110 | $4,030 | $25,080 |
| 2019 | $1,391 | $36,200 | $4,870 | $31,330 |
| 2018 | $1,313 | $36,200 | $4,870 | $31,330 |
| 2017 | $962 | $36,200 | $4,870 | $31,330 |
| 2016 | $962 | $29,110 | $4,030 | $25,080 |
| 2015 | $958 | $29,110 | $4,030 | $25,080 |
| 2014 | $937 | $29,110 | $4,030 | $25,080 |
| 2013 | $952 | $29,110 | $4,030 | $25,080 |
Source: Public Records
Map
Nearby Homes
Your Personal Tour Guide
Ask me questions while you tour the home.