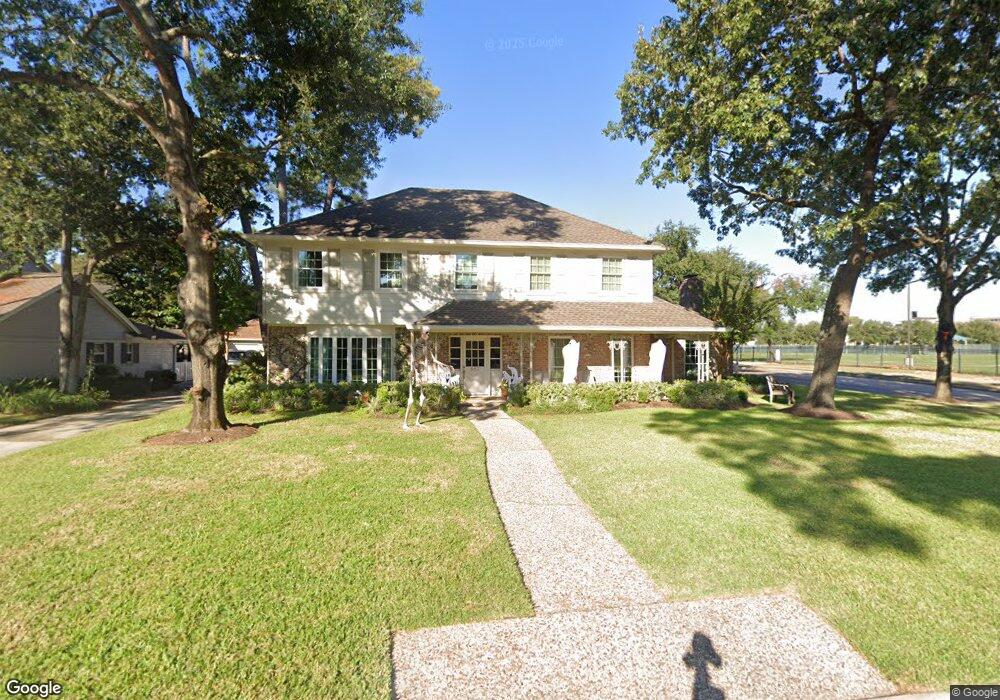
887 Glenchester St Houston, TX 77079
Memorial NeighborhoodEstimated Value: $1,046,000 - $1,088,000
5
Beds
4
Baths
3,162
Sq Ft
$337/Sq Ft
Est. Value
About This Home
This home is located at 887 Glenchester St, Houston, TX 77079 and is currently estimated at $1,064,813, approximately $336 per square foot. 887 Glenchester St is a home located in Harris County with nearby schools including Wilchester Elementary School, Memorial Middle, and Stratford High School.
Ownership History
Date
Name
Owned For
Owner Type
Purchase Details
Closed on
Apr 27, 2022
Sold by
Weaver Scot F and Weaver Susan C
Bought by
Chapline Charles Kimble and Chapline Laura Marcucci
Current Estimated Value
Home Financials for this Owner
Home Financials are based on the most recent Mortgage that was taken out on this home.
Original Mortgage
$721,600
Outstanding Balance
$684,638
Interest Rate
5.11%
Mortgage Type
New Conventional
Estimated Equity
$380,175
Purchase Details
Closed on
Mar 9, 2007
Sold by
Visoski Steve B and Visoski Ruth B
Bought by
Weaver Scot F and Weaver Susan C
Home Financials for this Owner
Home Financials are based on the most recent Mortgage that was taken out on this home.
Original Mortgage
$475,000
Interest Rate
6.26%
Mortgage Type
Construction
Purchase Details
Closed on
May 4, 2005
Sold by
Visoski Steve B and Visoski Ruth B
Bought by
Visoski Steve B and Visoski Ruth B
Create a Home Valuation Report for This Property
The Home Valuation Report is an in-depth analysis detailing your home's value as well as a comparison with similar homes in the area
Home Values in the Area
Average Home Value in this Area
Purchase History
| Date | Buyer | Sale Price | Title Company |
|---|---|---|---|
| Chapline Charles Kimble | -- | New Title Company Name | |
| Weaver Scot F | -- | First American Title Ins Co | |
| Visoski Steve B | -- | -- |
Source: Public Records
Mortgage History
| Date | Status | Borrower | Loan Amount |
|---|---|---|---|
| Open | Chapline Charles Kimble | $721,600 | |
| Previous Owner | Weaver Scot F | $475,000 |
Source: Public Records
Tax History Compared to Growth
Tax History
| Year | Tax Paid | Tax Assessment Tax Assessment Total Assessment is a certain percentage of the fair market value that is determined by local assessors to be the total taxable value of land and additions on the property. | Land | Improvement |
|---|---|---|---|---|
| 2025 | $12,162 | $750,705 | $538,350 | $212,355 |
| 2024 | $12,162 | $750,705 | $538,350 | $212,355 |
| 2023 | $12,162 | $795,751 | $538,350 | $257,401 |
| 2022 | $15,816 | $730,172 | $511,433 | $218,739 |
| 2021 | $15,015 | $615,000 | $493,488 | $121,512 |
| 2020 | $15,264 | $609,194 | $493,488 | $115,706 |
| 2019 | $15,976 | $610,243 | $493,488 | $116,755 |
| 2018 | $6,067 | $635,000 | $493,488 | $141,512 |
| 2017 | $14,741 | $640,921 | $493,488 | $147,433 |
| 2016 | $13,401 | $640,921 | $493,488 | $147,433 |
| 2015 | $8,805 | $640,921 | $493,488 | $147,433 |
| 2014 | $8,805 | $519,187 | $340,955 | $178,232 |
Source: Public Records
Map
Nearby Homes
- 903 Wycliffe Dr
- 807 Wycliffe Dr
- 807 Patchester Dr
- 710 Patchester Dr
- 11102 Savannah Oaks Ln
- 1110 W Tri Oaks Ln Unit 157
- 11411 Ash Creek Dr
- 1113 Sherwood Trail
- 1108 W Tri Oaks Ln Unit 150
- 11402 Ash Creek Dr
- 1129 Sherwood Run
- 11027 Acorn Falls Dr
- 11005 Acorn Falls Dr
- 11116 Sherwood Oak Ln
- 1110 Oakwood Pass Ct
- 1303 Edwinstowe Trail
- 866 Myrtlea Ln
- 13931 Kingsride Ln
- 10923 Grove Tree Ln
- 10915 Grove Tree Ln
- 883 Glenchester St
- 13519 Saint Marys Ln
- 879 Glenchester St
- 879 Glenchester Dr
- 13518 Myrtlea Dr
- 13518 Saint Marys Ln
- 13515 Saint Marys Ln
- 875 Glenchester St
- 13514 Myrtlea Dr
- 13514 Saint Marys Ln
- 13511 Saint Marys Ln
- 871 Glenchester St
- 871 Glenchester Dr
- 13519 Westport Ln
- 13519 Myrtlea Dr
- 13510 Myrtlea Dr
- 13510 Saint Marys Ln
- 13515 Westport Ln
- 13515 Myrtlea Dr
- 867 Glenchester St