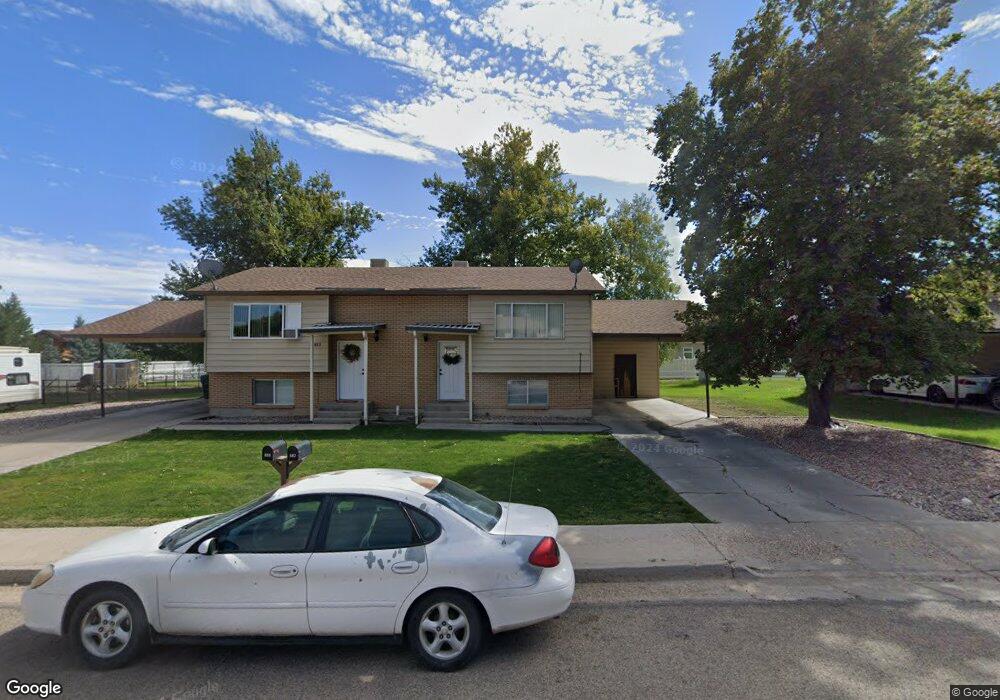
887 W 400 S Vernal, UT 84078
Estimated Value: $222,000 - $364,000
2
Beds
4
Baths
2,488
Sq Ft
$117/Sq Ft
Est. Value
About This Home
This home is located at 887 W 400 S, Vernal, UT 84078 and is currently estimated at $292,291, approximately $117 per square foot. 887 W 400 S is a home located in Uintah County with nearby schools including Discovery School, Vernal Middle School, and Uintah Middle School.
Ownership History
Date
Name
Owned For
Owner Type
Purchase Details
Closed on
Mar 30, 2022
Sold by
Scott Mark A and Scott Kerry
Bought by
Fazli Grigore and Dundev Tamara
Current Estimated Value
Home Financials for this Owner
Home Financials are based on the most recent Mortgage that was taken out on this home.
Original Mortgage
$225,000
Outstanding Balance
$183,935
Interest Rate
3.63%
Mortgage Type
Balloon
Estimated Equity
$108,356
Create a Home Valuation Report for This Property
The Home Valuation Report is an in-depth analysis detailing your home's value as well as a comparison with similar homes in the area
Home Values in the Area
Average Home Value in this Area
Purchase History
| Date | Buyer | Sale Price | Title Company |
|---|---|---|---|
| Fazli Grigore | -- | Basin Land Title | |
| Fazli Grigore | -- | Basin Land Title |
Source: Public Records
Mortgage History
| Date | Status | Borrower | Loan Amount |
|---|---|---|---|
| Open | Fazli Grigore | $225,000 | |
| Closed | Fazli Grigore | $225,000 |
Source: Public Records
Tax History Compared to Growth
Tax History
| Year | Tax Paid | Tax Assessment Tax Assessment Total Assessment is a certain percentage of the fair market value that is determined by local assessors to be the total taxable value of land and additions on the property. | Land | Improvement |
|---|---|---|---|---|
| 2024 | $1,214 | $137,780 | $16,524 | $121,256 |
| 2023 | $1,214 | $119,284 | $16,524 | $102,760 |
| 2022 | $1,177 | $108,951 | $15,878 | $93,073 |
| 2021 | $1,206 | $50,692 | $8,733 | $41,959 |
| 2020 | $1,068 | $83,993 | $15,878 | $68,115 |
| 2019 | $1,083 | $83,993 | $15,878 | $68,115 |
| 2018 | $1,084 | $83,993 | $15,878 | $68,115 |
| 2017 | $11 | $84,425 | $19,847 | $64,578 |
| 2016 | $1,123 | $95,821 | $19,847 | $75,974 |
| 2015 | $1,037 | $95,821 | $19,847 | $75,974 |
| 2014 | $1,023 | $95,821 | $19,847 | $75,974 |
| 2013 | $1,045 | $95,821 | $19,847 | $75,974 |
Source: Public Records
Map
Nearby Homes