8870 Glen Ferry Dr Unit 1 Alpharetta, GA 30022
Rivermont NeighborhoodEstimated payment $5,667/month
Highlights
- Community Lake
- Dining Room Seats More Than Twelve
- Deck
- Barnwell Elementary School Rated A
- Clubhouse
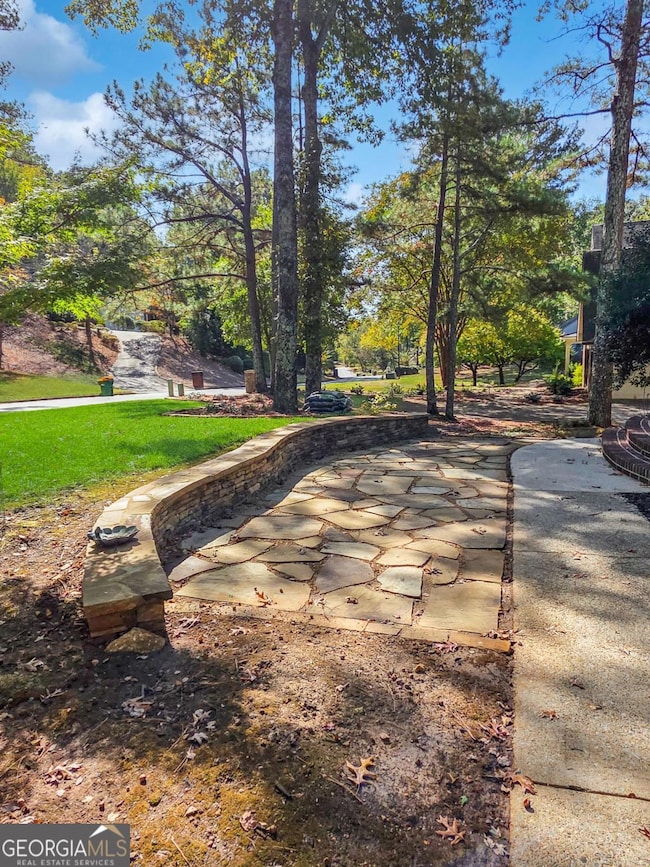
- Private Lot
About This Home
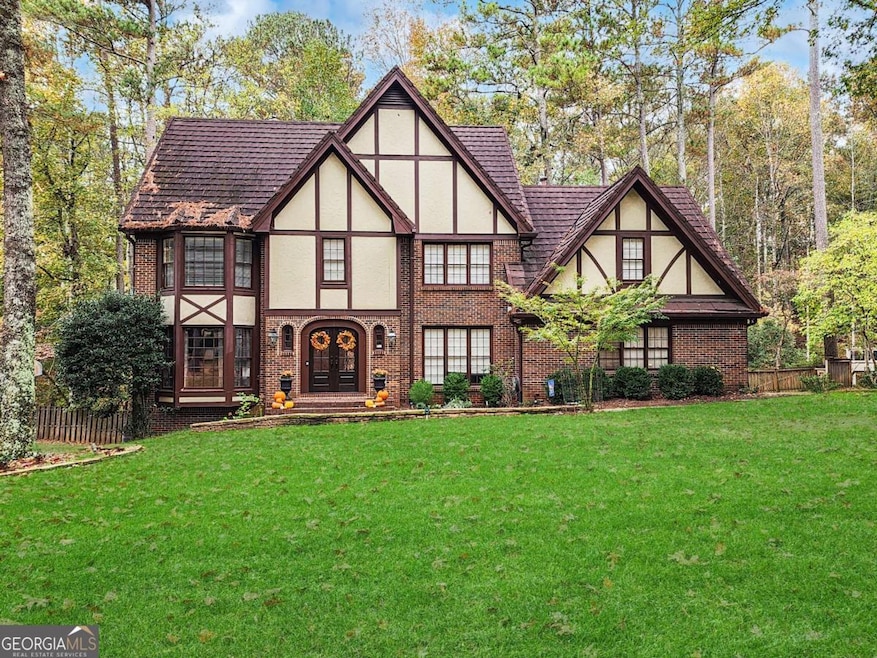
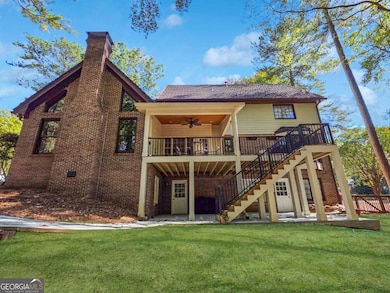
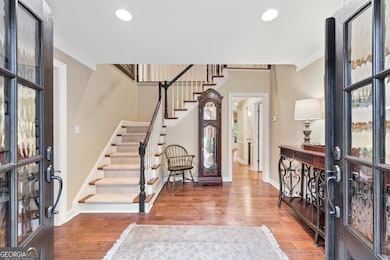
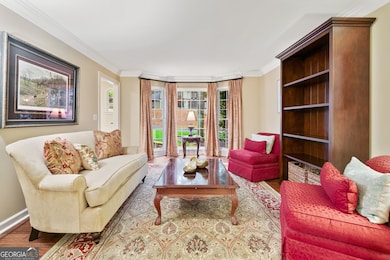
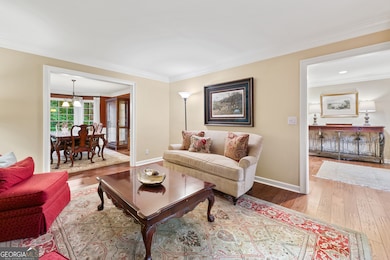
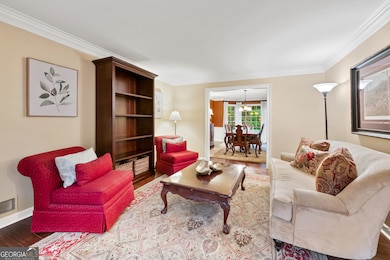
Nature Lovers' Dream - Welcome to 8870 Glen Ferry Drive, where luxury meets the wild beauty of the Chattahoochee Forest. Nestled in the sought-after River Glen community, this stunning 5-bedroom, 4.5-bath traditional home offers serene living with modern comfort - and direct access to nature right outside your door. Additionally, there's a Full guest suite on the main. Inside, you'll find a spacious, light-filled main level featuring a vaulted-ceiling family room with a cozy wood-burning fireplace (with gas starter), Gleaming wood floors, and a covered porch that feels like a treehouse. Enjoy wooded views and a large fenced backyard, perfect for relaxation or play. The chef's kitchen boasts granite countertops, a walk-in pantry, and access to the covered porch - your new favorite spot for morning coffee or al fresco dining. Upstairs, the primary suite offers a tray ceiling, soaking tub, double vanities, and peaceful forest views. Two bedrooms share a Jack-and-Jill bath, while another guest suite and convenient upstairs laundry complete the level. Dual staircases add both charm and convenience. The fully finished basement expands your living space with new Luxury Vinyl flooring, a fireside family room, half bath, flex room ideal for fitness or a guest bedroom (with closet), private exterior entrance, and ample storage. Outside, you'll love the covered patio with a cooling ceiling fan - the perfect private retreat surrounded by tranquil forest views. Residents of River Glen on the Chattahoochee enjoy exclusive access to scenic walking trails, a private lake, and abundant wildlife - from deer and turkeys to owls, hawks, and even eagles. With homes in this neighborhood averaging just five days on the market, now's the time to act. Whether you crave space, serenity, or adventure, 8870 Glen Ferry Drive offers it all. This is more than a home - it's a lifestyle.
Home Details
Home Type
- Single Family
Est. Annual Taxes
- $6,647
Year Built
- Built in 1984
Lot Details
- 0.52 Acre Lot
- Back Yard Fenced
- Private Lot
HOA Fees
- $96 Monthly HOA Fees
Home Design
- Tudor Architecture
- Metal Roof
- Concrete Siding
- Three Sided Brick Exterior Elevation
Interior Spaces
- 3-Story Property
- Rear Stairs
- Beamed Ceilings
- Vaulted Ceiling
- Ceiling Fan
- Entrance Foyer
- Family Room with Fireplace
- 2 Fireplaces
- Great Room
- Dining Room Seats More Than Twelve
- Breakfast Room
- Home Gym
- Fire and Smoke Detector
Kitchen
- Walk-In Pantry
- Microwave
- Dishwasher
- Disposal
Flooring
- Wood
- Carpet
- Laminate
Bedrooms and Bathrooms
- Double Vanity
- Soaking Tub
Laundry
- Laundry Room
- Laundry on upper level
Finished Basement
- Basement Fills Entire Space Under The House
- Exterior Basement Entry
- Fireplace in Basement
- Finished Basement Bathroom
- Stubbed For A Bathroom
Parking
- 2 Car Garage
- Parking Accessed On Kitchen Level
- Side or Rear Entrance to Parking
- Garage Door Opener
Outdoor Features
- Deck
Location
- Property is near schools
- Property is near shops
Schools
- Barnwell Elementary School
- Autrey Milll Middle School
- Johns Creek High School
Utilities
- Central Heating and Cooling System
- Underground Utilities
- Phone Available
- Cable TV Available
Community Details
Overview
- $1,000 Initiation Fee
- Association fees include swimming, tennis
- River Glen Subdivision
- Community Lake
Amenities
- Clubhouse
Recreation
- Tennis Courts
- Community Playground
- Community Pool
- Park
Map
Home Values in the Area
Average Home Value in this Area
Tax History
| Year | Tax Paid | Tax Assessment Tax Assessment Total Assessment is a certain percentage of the fair market value that is determined by local assessors to be the total taxable value of land and additions on the property. | Land | Improvement |
|---|---|---|---|---|
| 2025 | $6,647 | $322,040 | $81,800 | $240,240 |
| 2023 | $7,830 | $277,400 | $69,200 | $208,200 |
| 2022 | $6,138 | $233,560 | $61,160 | $172,400 |
| 2021 | $5,922 | $207,880 | $44,720 | $163,160 |
| 2020 | $6,223 | $229,600 | $36,800 | $192,800 |
| 2019 | $711 | $225,560 | $36,160 | $189,400 |
| 2018 | $6,775 | $220,280 | $35,320 | $184,960 |
| 2017 | $5,804 | $182,680 | $28,040 | $154,640 |
| 2016 | $5,219 | $168,000 | $32,240 | $135,760 |
| 2015 | $5,277 | $168,000 | $32,240 | $135,760 |
| 2014 | $5,465 | $168,000 | $32,240 | $135,760 |
Property History
| Date | Event | Price | List to Sale | Price per Sq Ft |
|---|---|---|---|---|
| 10/30/2025 10/30/25 | For Sale | $950,000 | -- | $181 / Sq Ft |
Purchase History
| Date | Type | Sale Price | Title Company |
|---|---|---|---|
| Warranty Deed | -- | -- | |
| Warranty Deed | $305,500 | -- | |
| Deed | $382,400 | -- | |
| Deed | $272,000 | -- |
Mortgage History
| Date | Status | Loan Amount | Loan Type |
|---|---|---|---|
| Open | $305,500 | New Conventional | |
| Closed | $305,500 | New Conventional | |
| Previous Owner | $344,160 | New Conventional | |
| Previous Owner | $170,000 | New Conventional |
Source: Georgia MLS
MLS Number: 10634047
APN: 11-0111-0021-011-5
Disclaimer: Certain information contained herein is derived from information provided by parties other than Homes.com. All information provided is deemed reliable, but is not guaranteed to be accurate and should be independently verified.
![]() The data relating to real estate for sale on this web site comes in part from the Broker Reciprocity Program of Georgia MLS. Real estate listings held by brokerage firms other than Redfin are marked with the Broker Reciprocity logo and detailed information about them includes the name of the listing brokers. Information deemed reliable but not guaranteed. Copyright 2025 Georgia MLS. All rights reserved.
The data relating to real estate for sale on this web site comes in part from the Broker Reciprocity Program of Georgia MLS. Real estate listings held by brokerage firms other than Redfin are marked with the Broker Reciprocity logo and detailed information about them includes the name of the listing brokers. Information deemed reliable but not guaranteed. Copyright 2025 Georgia MLS. All rights reserved.
- 8800 Glen Ferry Dr
- 98 Holly Isles-Harvel Pond Rd
- 0 Spyglass Bluff Unit 7666454
- 0 Spyglass Bluff Unit 10628282
- 420 Sandwedge Ln
- 530 Matterhorn Way
- 1050 Bedford Gardens Dr
- 765 Olde Clubs Dr
- 340 Mount Mitchell Way
- 240 Fairway Ridge Dr
- 9025 Niblic Dr
- 235 Stoney Ridge Dr
- 225 Brassy Ct
- 352 N Peak Dr
- 0 Niblick Dr Unit 7655286
- 8870 Old Southwick Pass
- 9005 Old Southwick Pass
- 150 Stoney Ridge Dr
- 355 Elbe Dr
- 1112 Sandy Ln Dr
- 515 Cypress Pointe St
- 509 Cypress Pointe St
- 1213 Waterville Ct
- 9155 Nesbit Ferry Rd Unit 57
- 9155 Nesbit Ferry Rd Unit 127
- 219 Saint Andrews Ct
- 215 Kirkton Knolls Unit basement apt
- 9026 Riverbend Manor
- 802 Jamont Blvd
- 4341 Hammerstone Ct
- 3426 Jamont Blvd
- 100 Saratoga Dr
- 2745 Holcomb Bridge Rd
- 8520 S Holcomb Bridge Way
- 9230 Nesbit Ferry Rd
- 3550 River Trace Dr Unit BASEMENT
- 115 White River Ct
- 2745 Holcomb Bridge Rd Unit 1332.1410843
