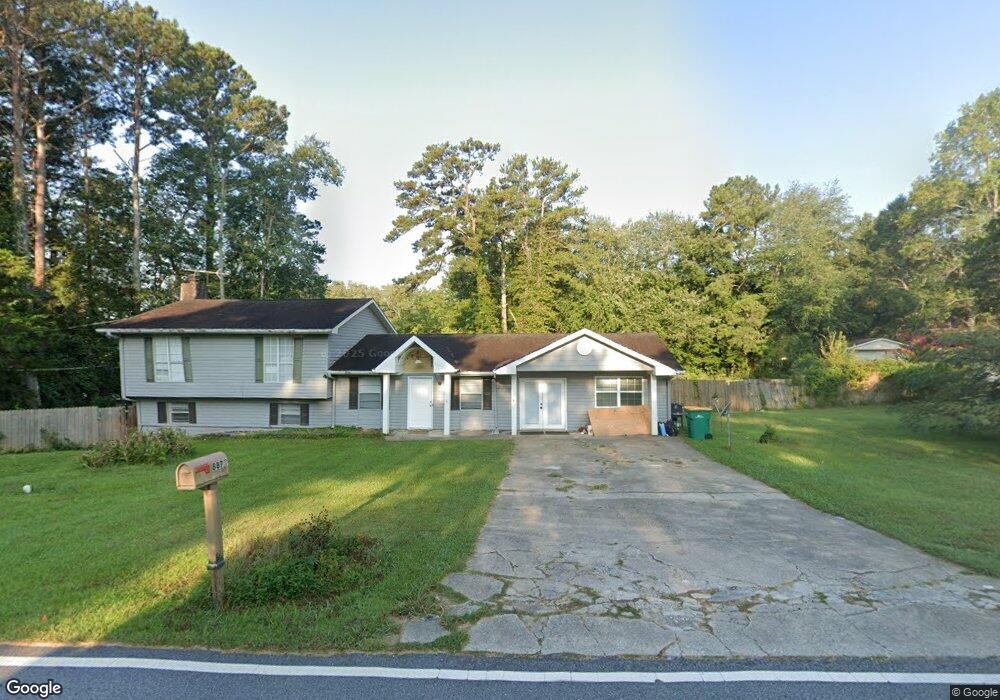
8873 Thornton Rd Unit 2 Jonesboro, GA 30236
Estimated Value: $237,000 - $258,000
4
Beds
2
Baths
2,188
Sq Ft
$113/Sq Ft
Est. Value
About This Home
This home is located at 8873 Thornton Rd Unit 2, Jonesboro, GA 30236 and is currently estimated at $247,448, approximately $113 per square foot. 8873 Thornton Rd Unit 2 is a home located in Clayton County with nearby schools including Suder Elementary School, M. D. Roberts Middle School, and Jonesboro High School.
Ownership History
Date
Name
Owned For
Owner Type
Purchase Details
Closed on
Jan 11, 2023
Sold by
Atlanta Bbc Investment Llc
Bought by
Ntn Austin Llc
Current Estimated Value
Purchase Details
Closed on
Oct 23, 2014
Sold by
Tran My Ngoc
Bought by
Atlanta Bbc Investment Llc
Purchase Details
Closed on
Sep 18, 2012
Sold by
Nguyen Nhung T
Bought by
Tran My Ngoc
Purchase Details
Closed on
Mar 31, 2011
Sold by
Federal Natl Mtg Assn Fnma
Bought by
Nguyen Nhung T
Purchase Details
Closed on
Oct 5, 2010
Sold by
Citimortgage
Bought by
Federal Natl Mtg Assn Fnma
Purchase Details
Closed on
Apr 9, 1998
Sold by
Davis Betty C
Bought by
Litton Deborah K and Litton Joseph E
Home Financials for this Owner
Home Financials are based on the most recent Mortgage that was taken out on this home.
Original Mortgage
$99,101
Interest Rate
7.06%
Mortgage Type
New Conventional
Purchase Details
Closed on
May 6, 1997
Sold by
Cowart William J and Cowart Udy M
Bought by
Davis Betty C
Create a Home Valuation Report for This Property
The Home Valuation Report is an in-depth analysis detailing your home's value as well as a comparison with similar homes in the area
Home Values in the Area
Average Home Value in this Area
Purchase History
| Date | Buyer | Sale Price | Title Company |
|---|---|---|---|
| Ntn Austin Llc | -- | -- | |
| Atlanta Bbc Investment Llc | $65,000 | -- | |
| Tran My Ngoc | -- | -- | |
| Nguyen Nhung T | -- | -- | |
| Federal Natl Mtg Assn Fnma | -- | -- | |
| Citimortgage | $135,589 | -- | |
| Litton Deborah K | $120,000 | -- | |
| Davis Betty C | $22,993 | -- |
Source: Public Records
Mortgage History
| Date | Status | Borrower | Loan Amount |
|---|---|---|---|
| Previous Owner | Litton Deborah K | $99,101 |
Source: Public Records
Tax History Compared to Growth
Tax History
| Year | Tax Paid | Tax Assessment Tax Assessment Total Assessment is a certain percentage of the fair market value that is determined by local assessors to be the total taxable value of land and additions on the property. | Land | Improvement |
|---|---|---|---|---|
| 2024 | $3,516 | $90,120 | $10,400 | $79,720 |
| 2023 | $3,125 | $86,560 | $10,400 | $76,160 |
| 2022 | $2,622 | $66,800 | $10,400 | $56,400 |
| 2021 | $2,370 | $60,000 | $10,400 | $49,600 |
| 2020 | $1,756 | $51,665 | $10,400 | $41,265 |
| 2019 | $2,017 | $49,683 | $9,600 | $40,083 |
| 2018 | $1,859 | $45,800 | $9,600 | $36,200 |
| 2017 | $1,649 | $40,527 | $9,600 | $30,927 |
| 2016 | $1,370 | $33,675 | $9,600 | $24,075 |
| 2015 | $1,040 | $0 | $0 | $0 |
| 2014 | $1,018 | $25,600 | $9,600 | $16,000 |
Source: Public Records
Map
Nearby Homes
- 8832 Twin Oaks Dr Unit 2
- 1738 Sherry Ln Unit 3
- 1726 Sherry Ln
- 8698 Twin Oaks Dr
- 1976 Emerald Dr
- 57 Teal Trail NE
- 111 Teal Trail
- 1558 Thornwood Ct
- 9124 Ogala Ct
- 9132 Endicott Place
- 9176 Chickasaw Ct
- 1457 Brownleaf Dr
- 1907 Spivey Village Cir
- 8645 Embrey Dr
- 1519 Red Briar Way
- 1485 Red Briar Way
- 9243 Seminole Rd
- 304 Mercer Dr
- 242 Lake Jodeco Rd
- 2220 Emerald Dr
- 1789 Lake Jodeco Rd
- 1783 Lake Jodeco Rd
- 1797 Lake Jodeco Rd
- 1797 Lake Jodeco Rd Unit 1AC
- 1743 Drakes Dr
- 8884 Thornton Rd
- 1809 Lake Jodeco Rd
- 1775 Drakes Dr Unit 2
- 8833 Twin Oaks Dr
- 8880 Thornton Rd
- 1731 Drakes Dr
- 1821 Lake Jodeco Rd
- 1723 Drakes Dr
- 8821 Twin Oaks Dr
- 1738 Drakes Dr
- 8820 Twin Oaks Dr
- 8894 Thornton Rd
- 1833 Lake Jodeco Rd
- 1728 Drakes Dr
- 1780 Lake Jodeco Rd