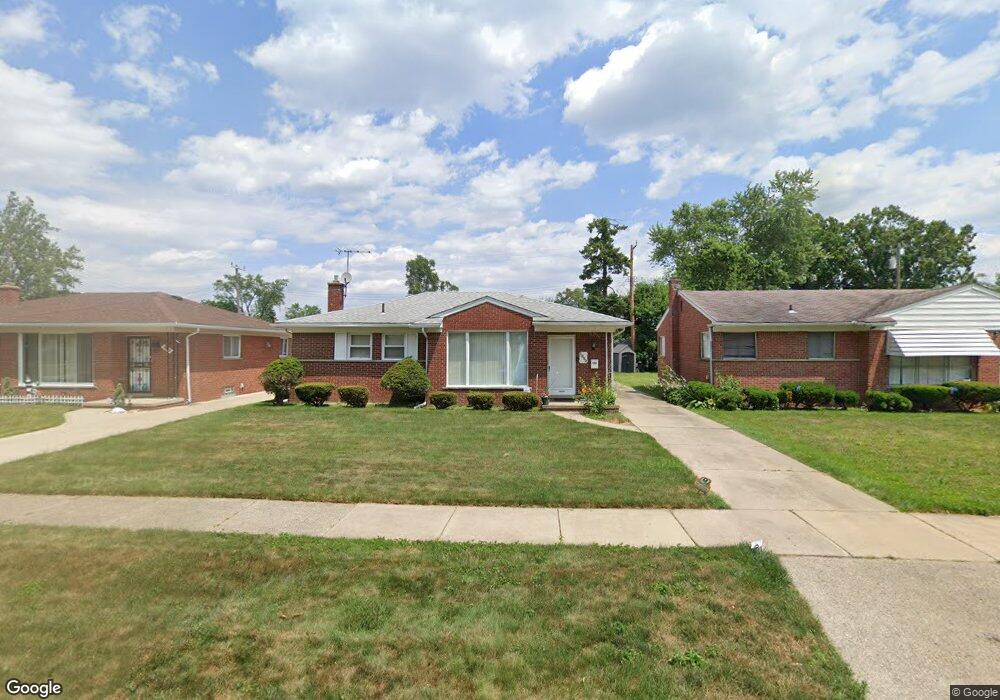
8874 Appleton Redford, MI 48239
Estimated Value: $157,633 - $257,000
3
Beds
1
Bath
1,013
Sq Ft
$199/Sq Ft
Est. Value
About This Home
This home is located at 8874 Appleton, Redford, MI 48239 and is currently estimated at $201,908, approximately $199 per square foot. 8874 Appleton is a home located in Wayne County with nearby schools including John D. Pierce Middle School, Lee M. Thurston High School, and Global Heights Academy.
Ownership History
Date
Name
Owned For
Owner Type
Purchase Details
Closed on
Mar 14, 2019
Sold by
Bosak Dennis J
Bought by
Virden Property Management Llc
Current Estimated Value
Purchase Details
Closed on
Feb 28, 2008
Sold by
Mortgage Electronic Registration Systems
Bought by
Us Bank Na
Purchase Details
Closed on
Jan 9, 2008
Sold by
Nocella Mark
Bought by
Mortgage Electronic Registration Systems
Purchase Details
Closed on
Aug 25, 2006
Sold by
Hollis Nichelle J and Howell Steven
Bought by
Nocella Mark
Purchase Details
Closed on
Mar 1, 2006
Sold by
Howell Nichelle J Hollis and Howell Steven
Bought by
Deutsche Bank National Trust Co and Mlmi Trust Series 2005-Nc1
Create a Home Valuation Report for This Property
The Home Valuation Report is an in-depth analysis detailing your home's value as well as a comparison with similar homes in the area
Home Values in the Area
Average Home Value in this Area
Purchase History
| Date | Buyer | Sale Price | Title Company |
|---|---|---|---|
| Virden Property Management Llc | -- | None Available | |
| Us Bank Na | -- | E Title Agency | |
| Mortgage Electronic Registration Systems | $88,400 | None Available | |
| Nocella Mark | $130,000 | Multiple | |
| Deutsche Bank National Trust Co | $93,420 | None Available |
Source: Public Records
Tax History Compared to Growth
Tax History
| Year | Tax Paid | Tax Assessment Tax Assessment Total Assessment is a certain percentage of the fair market value that is determined by local assessors to be the total taxable value of land and additions on the property. | Land | Improvement |
|---|---|---|---|---|
| 2025 | $841 | $71,200 | $0 | $0 |
| 2024 | $818 | $63,400 | $0 | $0 |
| 2023 | $782 | $55,000 | $0 | $0 |
| 2022 | $2,113 | $46,900 | $0 | $0 |
| 2021 | $2,052 | $45,000 | $0 | $0 |
| 2020 | $2,024 | $40,200 | $0 | $0 |
| 2019 | $1,983 | $31,000 | $0 | $0 |
| 2018 | $697 | $26,200 | $0 | $0 |
| 2017 | $2,116 | $24,300 | $0 | $0 |
| 2016 | $1,731 | $22,500 | $0 | $0 |
| 2015 | $2,100 | $21,000 | $0 | $0 |
| 2013 | $2,180 | $22,200 | $0 | $0 |
| 2012 | $1,920 | $24,500 | $6,900 | $17,600 |
Source: Public Records
Map
Nearby Homes