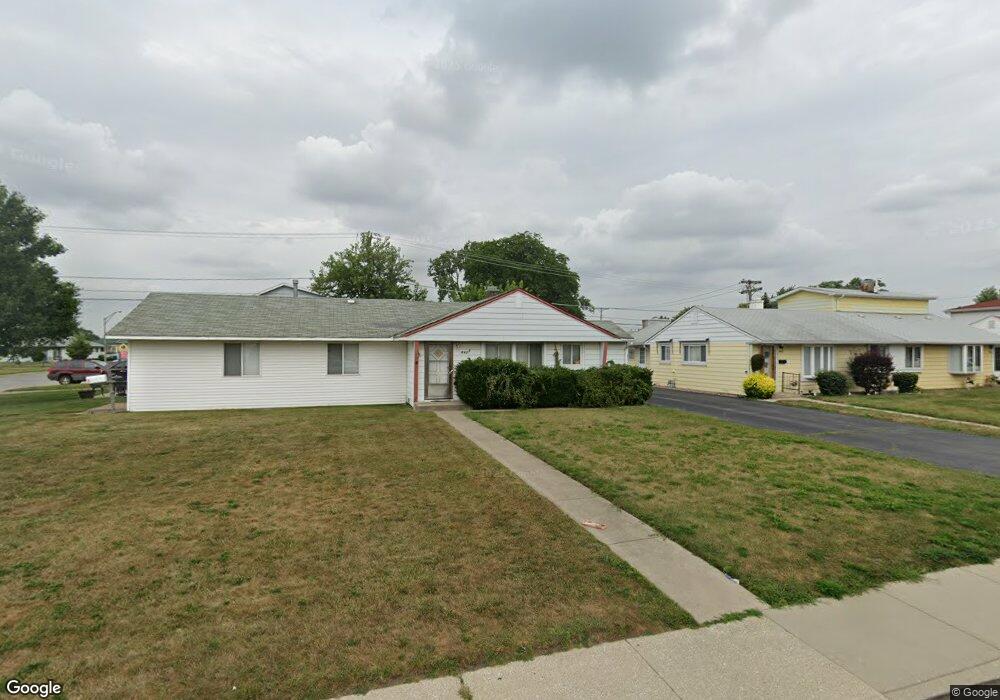
8876 S Corcoran Rd Hometown, IL 60456
Estimated Value: $183,000 - $270,000
2
Beds
1
Bath
750
Sq Ft
$289/Sq Ft
Est. Value
About This Home
This home is located at 8876 S Corcoran Rd, Hometown, IL 60456 and is currently estimated at $216,392, approximately $288 per square foot. 8876 S Corcoran Rd is a home located in Cook County with nearby schools including Hometown Elementary School, J Covington Elementary School, and Sward Elementary School.
Ownership History
Date
Name
Owned For
Owner Type
Purchase Details
Closed on
Jun 11, 2018
Sold by
Pinnacle Real Estate Investments Group L
Bought by
257 Investments Group Inc
Current Estimated Value
Purchase Details
Closed on
May 31, 2018
Sold by
Hilbred Lynn
Bought by
Pinnacle Real Estate Investments Group L
Purchase Details
Closed on
Apr 29, 2003
Sold by
Ryan Hugh R
Bought by
Hildred Lynn
Home Financials for this Owner
Home Financials are based on the most recent Mortgage that was taken out on this home.
Original Mortgage
$97,750
Interest Rate
11.55%
Mortgage Type
Unknown
Purchase Details
Closed on
Nov 1, 1995
Sold by
Bonnan Carmelia Nellie and Stocchi Clara Ellen
Bought by
Ryan Hugh Robert
Home Financials for this Owner
Home Financials are based on the most recent Mortgage that was taken out on this home.
Original Mortgage
$67,450
Interest Rate
7.65%
Create a Home Valuation Report for This Property
The Home Valuation Report is an in-depth analysis detailing your home's value as well as a comparison with similar homes in the area
Home Values in the Area
Average Home Value in this Area
Purchase History
| Date | Buyer | Sale Price | Title Company |
|---|---|---|---|
| 257 Investments Group Inc | -- | None Available | |
| Pinnacle Real Estate Investments Group L | $66,000 | None Available | |
| Hildred Lynn | $115,000 | Atgf Inc | |
| Ryan Hugh Robert | $71,000 | Intercounty Title |
Source: Public Records
Mortgage History
| Date | Status | Borrower | Loan Amount |
|---|---|---|---|
| Previous Owner | Hildred Lynn | $97,750 | |
| Previous Owner | Ryan Hugh Robert | $67,450 |
Source: Public Records
Tax History Compared to Growth
Tax History
| Year | Tax Paid | Tax Assessment Tax Assessment Total Assessment is a certain percentage of the fair market value that is determined by local assessors to be the total taxable value of land and additions on the property. | Land | Improvement |
|---|---|---|---|---|
| 2024 | $4,663 | $15,000 | $2,400 | $12,600 |
| 2023 | $4,140 | $15,000 | $2,400 | $12,600 |
| 2022 | $4,140 | $10,642 | $2,100 | $8,542 |
| 2021 | $4,014 | $10,642 | $2,100 | $8,542 |
| 2020 | $3,949 | $10,642 | $2,100 | $8,542 |
| 2019 | $4,264 | $11,767 | $1,900 | $9,867 |
| 2018 | $2,894 | $11,767 | $1,900 | $9,867 |
| 2017 | $2,909 | $11,767 | $1,900 | $9,867 |
| 2016 | $2,418 | $9,354 | $1,600 | $7,754 |
| 2015 | $2,345 | $9,354 | $1,600 | $7,754 |
| 2014 | $2,339 | $9,354 | $1,600 | $7,754 |
| 2013 | $2,733 | $11,564 | $1,600 | $9,964 |
Source: Public Records
Map
Nearby Homes
- 8955 S Corcoran Rd
- 4153 W 89th Place Unit 1
- 4308 W 91st Place
- 8925 S Main St
- 8928 S Ryan Rd
- 8755 S Corcoran Rd
- 8912 S Ryan Rd
- 4133 Southwest Hwy
- 4501 W 90th Place
- 4049 W 89th Place
- 4421 W 87th St
- 8772 S Kolmar Ave
- 8638 S Keeler Ave
- 8743 S Kenton Ave
- 9134 S Pulaski Rd Unit 2E
- 8618 S Kolmar Ave
- 4530 W 93rd St Unit 2B
- 4560 W 93rd St Unit 2D
- 10810 S Kilpatrick Ave Unit 1NE
- 9317 S Kolmar Ave
- 8878 S Corcoran Rd
- 8868 S Corcoran Rd
- 8877 S Beck Place
- 8871 S Beck Place
- 8879 S Beck Place
- 8862 S Corcoran Rd
- 8869 S Beck Place
- 8863 S Beck Place
- 8860 S Corcoran Rd
- 8900 S Corcoran Rd
- 8881 S Corcoran Rd
- 8875 S Corcoran Rd
- 8883 S Corcoran Rd
- 8861 S Beck Place
- 8873 S Corcoran Rd
- 8901 S Beck Place
- 8854 S Corcoran Rd
- 8854 S Corcoran Rd Unit 3
- 8867 S Corcoran Rd
- 8902 S Corcoran Rd