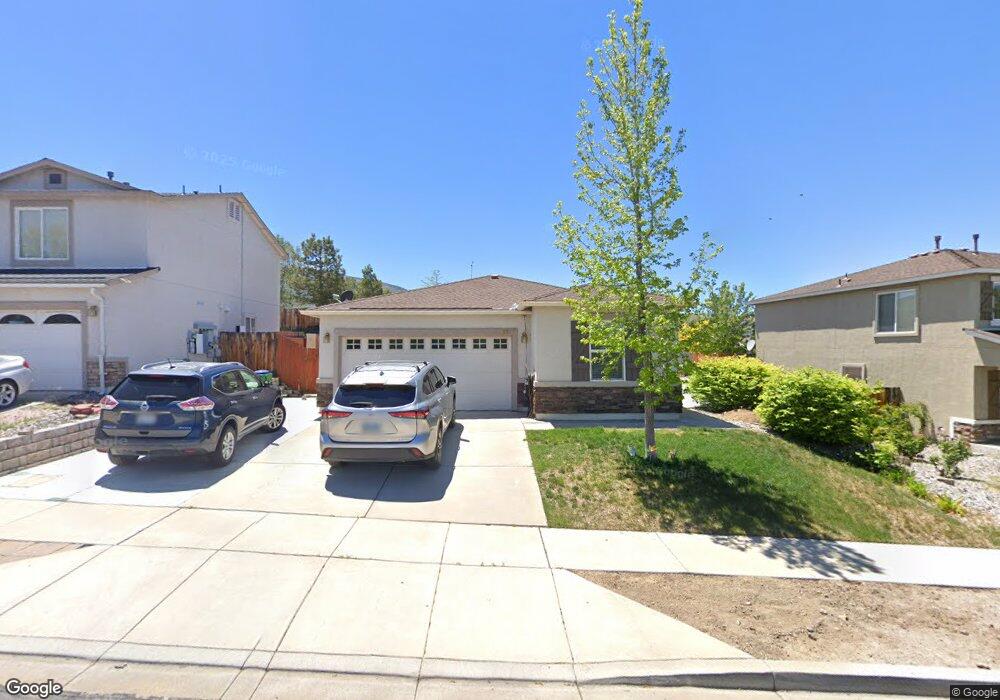
8877 Silverkist Dr Reno, NV 89506
Stead NeighborhoodEstimated Value: $388,162 - $426,000
3
Beds
2
Baths
1,246
Sq Ft
$328/Sq Ft
Est. Value
About This Home
This home is located at 8877 Silverkist Dr, Reno, NV 89506 and is currently estimated at $409,041, approximately $328 per square foot. 8877 Silverkist Dr is a home located in Washoe County with nearby schools including Stokesdale Elementary School, Silver Lake Elementary School, and Glenn C. Marlow Elementary School.
Ownership History
Date
Name
Owned For
Owner Type
Purchase Details
Closed on
Feb 27, 2013
Sold by
Hawkins Ryan A
Bought by
Hawkins Ryan A and Ryan Hawkins Trust
Current Estimated Value
Purchase Details
Closed on
Mar 5, 2009
Sold by
Schairer Bonnie
Bought by
Hawkins Ryan A
Home Financials for this Owner
Home Financials are based on the most recent Mortgage that was taken out on this home.
Original Mortgage
$126,352
Outstanding Balance
$79,089
Interest Rate
5.08%
Mortgage Type
FHA
Estimated Equity
$329,952
Purchase Details
Closed on
Aug 15, 2006
Sold by
Centex Homes
Bought by
Schairer Bonnie
Home Financials for this Owner
Home Financials are based on the most recent Mortgage that was taken out on this home.
Original Mortgage
$194,782
Interest Rate
7.87%
Mortgage Type
Balloon
Create a Home Valuation Report for This Property
The Home Valuation Report is an in-depth analysis detailing your home's value as well as a comparison with similar homes in the area
Home Values in the Area
Average Home Value in this Area
Purchase History
| Date | Buyer | Sale Price | Title Company |
|---|---|---|---|
| Hawkins Ryan A | -- | None Available | |
| Hawkins Ryan A | $129,000 | First Centennial Reno | |
| Schairer Bonnie | $243,500 | Commerce Title |
Source: Public Records
Mortgage History
| Date | Status | Borrower | Loan Amount |
|---|---|---|---|
| Open | Hawkins Ryan A | $126,352 | |
| Previous Owner | Schairer Bonnie | $194,782 |
Source: Public Records
Tax History Compared to Growth
Tax History
| Year | Tax Paid | Tax Assessment Tax Assessment Total Assessment is a certain percentage of the fair market value that is determined by local assessors to be the total taxable value of land and additions on the property. | Land | Improvement |
|---|---|---|---|---|
| 2026 | -- | $90,506 | $32,725 | $57,782 |
| 2025 | $1,626 | $91,046 | $32,270 | $58,776 |
| 2024 | $1,626 | $88,054 | $28,980 | $59,074 |
| 2023 | $1,579 | $83,467 | $27,790 | $55,677 |
| 2022 | $1,533 | $70,718 | $24,360 | $46,358 |
| 2021 | $1,489 | $65,134 | $19,075 | $46,059 |
| 2020 | $1,444 | $64,559 | $18,480 | $46,079 |
| 2019 | $1,402 | $62,697 | $18,235 | $44,462 |
| 2018 | $1,267 | $53,704 | $12,915 | $40,789 |
| 2017 | $1,230 | $52,811 | $12,040 | $40,771 |
| 2016 | $1,198 | $52,274 | $10,675 | $41,599 |
| 2015 | $1,196 | $50,441 | $8,960 | $41,481 |
| 2014 | $1,161 | $42,862 | $7,175 | $35,687 |
| 2013 | -- | $30,712 | $5,250 | $25,462 |
Source: Public Records
Map
Nearby Homes
- 8660 Sunrise Mist Ct
- 8678 Strutter Way
- 8602 Strutter Way
- 8696 Red Baron Blvd
- 7456 Creekland Dr
- 7663 Crystal Shores Dr
- 7497 Hebrides Ct
- 7447 Findhorn Dr
- 7462 Findhorn Dr
- 8486 Piper Place
- 8410 Red Baron Blvd
- 7085 Indigo Cir
- 11642 Green Mountain St
- 8419 Sopwith Blvd
- 12123 Andes St
- 12360 Rocky Mountain St
- 12190 Rocky Mountain St
- 12322 Rocky Mountain St
- 6995 Peppermint Dr
- 11019 Bornite Ct
- 8873 Silverkist Dr
- 8881 Silverkist Dr
- 8885 Silverkist Dr
- 8869 Silverkist Dr
- 7595 Silverkist Ct
- 8854 Sunset Breeze Dr
- 8889 Silverkist Dr
- 8865 Silverkist Dr
- 8858 Sunset Breeze Dr
- 7575 Silverkist Ct
- 8852 Silverkist Dr
- 8862 Sunset Breeze Dr
- 8884 Silverkist Dr
- 8893 Silverkist Dr
- 8888 Silverkist Dr
- 8892 Silverkist Dr
- 8897 Silverkist Dr
- 8866 Sunset Breeze Dr
- 8876 Silverkist Dr
- 8853 Silverkist Dr