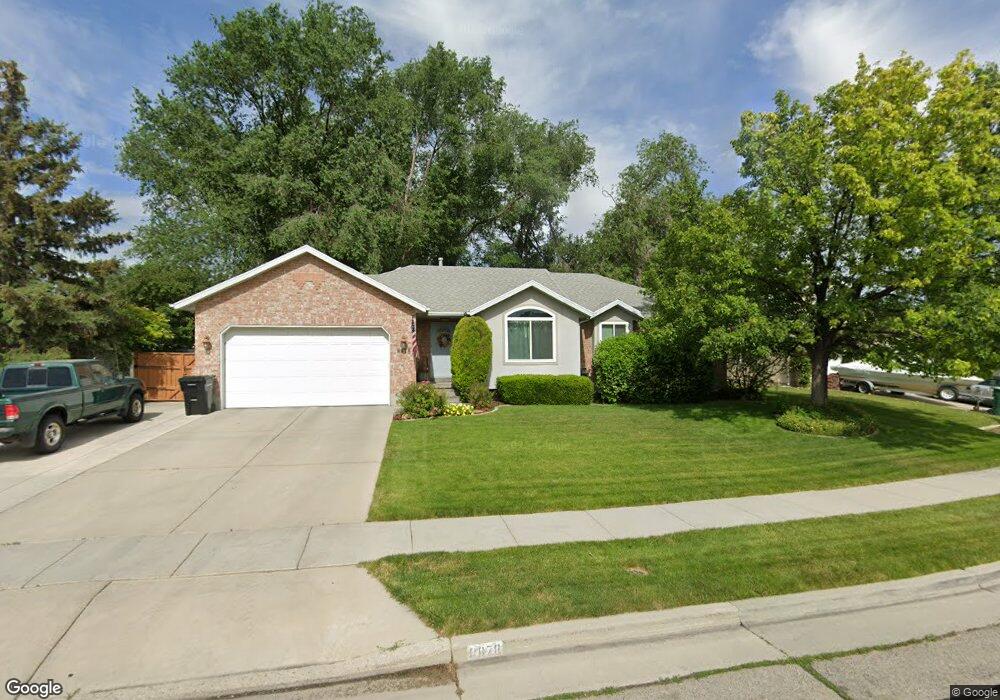
8878 Olive Grove Way West Jordan, UT 84088
Edenbrooke NeighborhoodEstimated Value: $576,880 - $637,000
3
Beds
2
Baths
3,100
Sq Ft
$194/Sq Ft
Est. Value
About This Home
This home is located at 8878 Olive Grove Way, West Jordan, UT 84088 and is currently estimated at $601,220, approximately $193 per square foot. 8878 Olive Grove Way is a home located in Salt Lake County with nearby schools including Westvale Elementary School, Joel P. Jensen Middle School, and West Jordan High School.
Ownership History
Date
Name
Owned For
Owner Type
Purchase Details
Closed on
Nov 28, 2000
Sold by
Watson Bruce
Bought by
Fuhriman Trevor J and Fuhriman Dayna Noelle
Current Estimated Value
Home Financials for this Owner
Home Financials are based on the most recent Mortgage that was taken out on this home.
Original Mortgage
$130,500
Outstanding Balance
$48,644
Interest Rate
7.86%
Estimated Equity
$552,576
Purchase Details
Closed on
May 1, 2000
Sold by
Rohner Jacob W
Bought by
Bruce Watson Construction
Purchase Details
Closed on
Oct 20, 1999
Sold by
Maxfield Mark A
Bought by
Rohner Jacob W
Purchase Details
Closed on
Jul 28, 1999
Sold by
Maxfield Mark A
Bought by
Bruce Watson Construction
Home Financials for this Owner
Home Financials are based on the most recent Mortgage that was taken out on this home.
Original Mortgage
$129,110
Interest Rate
7.89%
Create a Home Valuation Report for This Property
The Home Valuation Report is an in-depth analysis detailing your home's value as well as a comparison with similar homes in the area
Home Values in the Area
Average Home Value in this Area
Purchase History
| Date | Buyer | Sale Price | Title Company |
|---|---|---|---|
| Fuhriman Trevor J | -- | Founders Title | |
| Bruce Watson Construction | -- | Founders Title Company | |
| Rohner Jacob W | -- | Equity Title | |
| Bruce Watson Construction | -- | Founders Title |
Source: Public Records
Mortgage History
| Date | Status | Borrower | Loan Amount |
|---|---|---|---|
| Open | Fuhriman Trevor J | $130,500 | |
| Previous Owner | Bruce Watson Construction | $129,110 | |
| Closed | Fuhriman Trevor J | $10,000 |
Source: Public Records
Tax History Compared to Growth
Tax History
| Year | Tax Paid | Tax Assessment Tax Assessment Total Assessment is a certain percentage of the fair market value that is determined by local assessors to be the total taxable value of land and additions on the property. | Land | Improvement |
|---|---|---|---|---|
| 2025 | $2,909 | $564,100 | $150,900 | $413,200 |
| 2024 | $2,909 | $559,700 | $149,400 | $410,300 |
| 2023 | $2,870 | $520,400 | $146,400 | $374,000 |
| 2022 | $2,963 | $528,600 | $143,600 | $385,000 |
| 2021 | $2,503 | $406,500 | $99,000 | $307,500 |
| 2020 | $2,314 | $352,700 | $81,200 | $271,500 |
| 2019 | $2,333 | $348,700 | $81,200 | $267,500 |
| 2018 | $2,184 | $323,800 | $79,000 | $244,800 |
| 2017 | $2,069 | $305,300 | $79,000 | $226,300 |
| 2016 | $2,036 | $282,300 | $79,000 | $203,300 |
| 2015 | $2,039 | $275,700 | $80,500 | $195,200 |
| 2014 | $1,956 | $260,400 | $76,700 | $183,700 |
Source: Public Records
Map
Nearby Homes
- 3214 W Monterey Pine Ln
- 2970 W 8870 S
- 8493 S 3200 W
- 8886 S 2700 W
- 2883 Jana Lee Dr
- 8461 S Meadowlark Ln
- 3750 W Bingham Creek Dr
- 8983 S 3860 W
- 4000 W 8400 S Unit 83
- 3112 Green Acre Dr
- 2636 W 9110 S
- 8407 Meadow Green Way
- 3256 Star Fire Rd
- 3827 W Country Squire Dr
- 9294 S 2700 W
- 3888 W 8700 S
- 9441 S Newkirk St
- 3931 W Dansere Cir
- 3702 W Angus Dr
- 9178 Lisa Ave
- 8868 S Olive Grove Way Unit 308
- 8868 Olive Grove Way
- 8892 Olive Grove Way
- 8892 S Olive Grove Way
- 3328 Olive Grove Way
- 3328 W Olive Grove Way
- 3339 W Olive Tree Cir
- 3339 Olive Tree Cir
- 3338 Olive Grove Way
- 8881 Olive Grove Way
- 3331 Olive Tree Cir
- 8871 Olive Grove Way
- 8871 S Olive Grove Way
- 3331 W Olive Tree Cir
- 8891 Olive Grove Way
- 8891 S Olive Grove Way Unit 201
- 8891 S Olive Grove Way
- 3351 Olive Tree Cir
- 3351 Olive Tree Cir Unit 311
- 3338 W Olive Grove Way