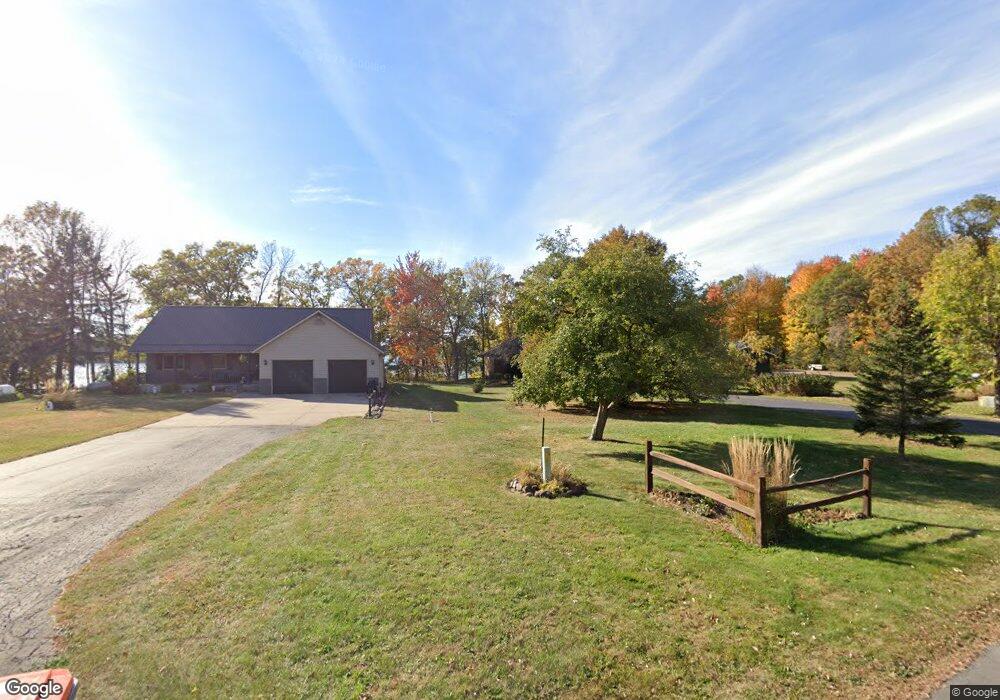
888 26 1/4 St Chetek, WI 54728
Estimated Value: $627,000 - $671,000
4
Beds
3
Baths
2,656
Sq Ft
$244/Sq Ft
Est. Value
About This Home
This home is located at 888 26 1/4 St, Chetek, WI 54728 and is currently estimated at $648,307, approximately $244 per square foot. 888 26 1/4 St is a home located in Barron County with nearby schools including Roselawn Elementary School, Chetek-Weyerhaeuser Middle School, and Chetek-Weyerhaeuser High School.
Ownership History
Date
Name
Owned For
Owner Type
Purchase Details
Closed on
Aug 20, 2019
Sold by
Brantner Levern F and Brantner Diane K
Bought by
Turnipseed Michael D
Current Estimated Value
Home Financials for this Owner
Home Financials are based on the most recent Mortgage that was taken out on this home.
Original Mortgage
$282,300
Outstanding Balance
$245,078
Interest Rate
3.8%
Mortgage Type
New Conventional
Estimated Equity
$403,229
Create a Home Valuation Report for This Property
The Home Valuation Report is an in-depth analysis detailing your home's value as well as a comparison with similar homes in the area
Purchase History
We collect this data history from publicly available records. To have your information removed, we recommend requesting removal directly through your county’s website.
| Date | Buyer | Sale Price | Title Company |
|---|---|---|---|
| Turnipseed Michael D | $352,900 | Attorney Only |
Source: Public Records
Mortgage History
We collect this data history from publicly available records. To have your information removed, we recommend requesting removal directly through your county’s website.
| Date | Status | Borrower | Loan Amount |
|---|---|---|---|
| Open | Turnipseed Michael D | $282,300 |
Source: Public Records
Tax History
| Year | Tax Paid | Tax Assessment Tax Assessment Total Assessment is a certain percentage of the fair market value that is determined by local assessors to be the total taxable value of land and additions on the property. | Land | Improvement |
|---|---|---|---|---|
| 2025 | $5,076 | $567,000 | $140,000 | $427,000 |
| 2024 | $4,842 | $277,000 | $70,000 | $207,000 |
| 2023 | $4,648 | $277,000 | $70,000 | $207,000 |
| 2022 | $4,686 | $277,000 | $70,000 | $207,000 |
| 2021 | $4,209 | $277,000 | $70,000 | $207,000 |
| 2020 | $4,231 | $277,000 | $70,000 | $207,000 |
| 2019 | $4,171 | $277,000 | $70,000 | $207,000 |
| 2018 | $4,412 | $277,000 | $70,000 | $207,000 |
| 2017 | $4,249 | $277,000 | $70,000 | $207,000 |
| 2016 | $4,175 | $277,000 | $70,000 | $207,000 |
| 2015 | $3,993 | $301,100 | $75,000 | $226,100 |
| 2014 | $4,362 | $301,100 | $75,000 | $226,100 |
| 2013 | $4,069 | $301,100 | $75,000 | $226,100 |
Source: Public Records
Map
Nearby Homes
- 810 26th St Unit 9
- Lot 1 9th Ave
- 2 25th St
- Lot 4 9 7 16 Ave
- 3.42 Acres 10th Ave
- 2608B 7 1 4 Ave
- 985 25 1 16 St Unit 1
- 252 Sumner Ave
- 2626 7 1 4 Ave Unit 5
- 2626 7 1 4 Ave Unit 8
- XX 9 3 4 Ave
- 1213 2nd St
- Lot 6 25-25 1 4 St
- TBD Lot 7 10 1 4 Ave
- Lot 11 25-25 1 4 St
- 420 Schofield St
- Lot 3 10 & 25 1 4 Ave
- Lot 13 10 1 4 Ave
- Lot 12 10 1 4 Ave
- 519 Schofield St
Your Personal Tour Guide
Ask me questions while you tour the home.