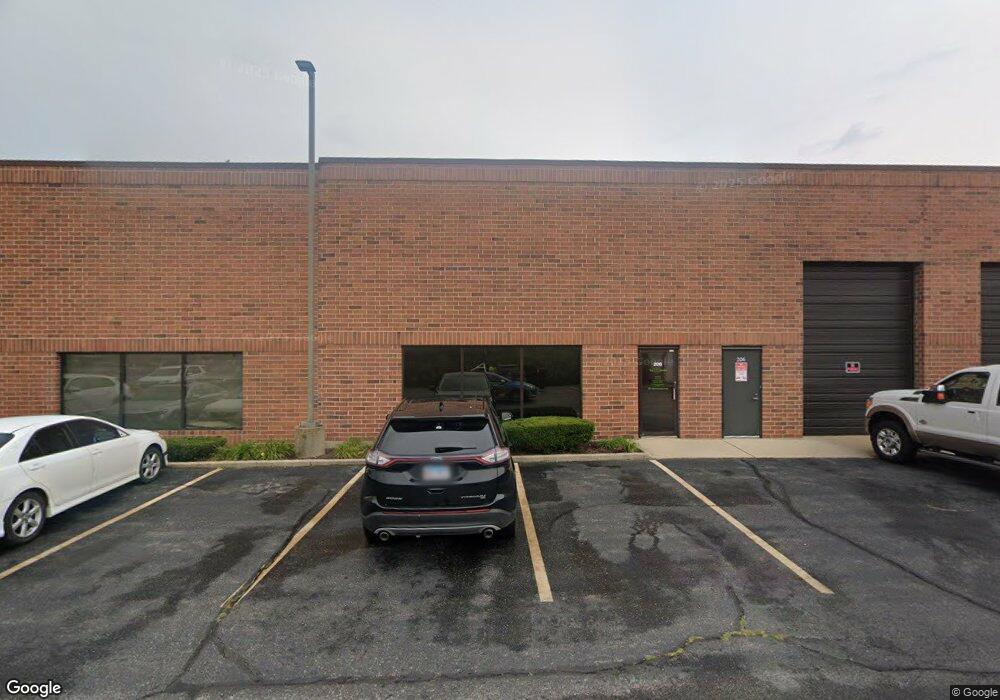
888 E Belvidere Rd Unit 211 Grayslake, IL 60030
Estimated Value: $368,113
--
Bed
--
Bath
--
Sq Ft
--
Built
About This Home
This home is located at 888 E Belvidere Rd Unit 211, Grayslake, IL 60030 and is currently estimated at $368,113. 888 E Belvidere Rd Unit 211 is a home located in Lake County with nearby schools including Frederick School, Woodview School, and Grayslake Middle School.
Ownership History
Date
Name
Owned For
Owner Type
Purchase Details
Closed on
Mar 2, 2016
Sold by
J Kg Properties Llc
Bought by
B2 Property Management Llc
Current Estimated Value
Home Financials for this Owner
Home Financials are based on the most recent Mortgage that was taken out on this home.
Original Mortgage
$156,000
Outstanding Balance
$123,473
Interest Rate
3.65%
Mortgage Type
Commercial
Estimated Equity
$244,640
Purchase Details
Closed on
Sep 15, 2010
Sold by
Des Lauries Family Limited Partnership I
Bought by
Jkg Properties Llc
Home Financials for this Owner
Home Financials are based on the most recent Mortgage that was taken out on this home.
Original Mortgage
$142,689
Interest Rate
4.26%
Mortgage Type
Commercial
Purchase Details
Closed on
Dec 14, 2001
Sold by
Deslauries Alfred J and Deslauries Gary A
Bought by
The Deslauries Family Ltd Partnership Ii
Create a Home Valuation Report for This Property
The Home Valuation Report is an in-depth analysis detailing your home's value as well as a comparison with similar homes in the area
Home Values in the Area
Average Home Value in this Area
Purchase History
| Date | Buyer | Sale Price | Title Company |
|---|---|---|---|
| B2 Property Management Llc | $195,000 | Ct | |
| Jkg Properties Llc | $190,000 | Chicago Title Insurance Co | |
| The Deslauries Family Ltd Partnership Ii | -- | -- |
Source: Public Records
Mortgage History
| Date | Status | Borrower | Loan Amount |
|---|---|---|---|
| Open | B2 Property Management Llc | $156,000 | |
| Previous Owner | Jkg Properties Llc | $142,689 |
Source: Public Records
Tax History Compared to Growth
Tax History
| Year | Tax Paid | Tax Assessment Tax Assessment Total Assessment is a certain percentage of the fair market value that is determined by local assessors to be the total taxable value of land and additions on the property. | Land | Improvement |
|---|---|---|---|---|
| 2024 | $6,917 | $64,071 | $4,723 | $59,348 |
| 2023 | $7,024 | $58,803 | $4,335 | $54,468 |
| 2022 | $7,024 | $58,567 | $7,551 | $51,016 |
| 2021 | $6,962 | $56,293 | $7,258 | $49,035 |
| 2020 | $6,985 | $53,562 | $6,906 | $46,656 |
| 2019 | $6,759 | $51,389 | $6,626 | $44,763 |
| 2018 | $6,829 | $52,114 | $8,471 | $43,643 |
| 2017 | $6,809 | $49,021 | $7,968 | $41,053 |
| 2016 | $6,578 | $45,251 | $7,355 | $37,896 |
| 2015 | $6,462 | $41,340 | $6,719 | $34,621 |
| 2014 | $7,221 | $46,175 | $5,705 | $40,470 |
| 2012 | $7,045 | $48,224 | $5,958 | $42,266 |
Source: Public Records
Map
Nearby Homes
- 390 N Garfield Blvd
- 1191 Hummingbird Ln
- 1617 Albany St
- 146 Westerfield Place
- 23 Bobolink Dr
- 399 Banbury Ln
- 121 Park Ave
- 10 Glen St
- 349 Brittain Ave
- 566 Chard Ct
- 11 S Lake St
- 42 Village Station Ln
- 634 Robin Ct
- 633 Dove Ct Unit 4
- 102 Soo Line Dr
- 533 Cannon Ball Dr
- 418 Flanders Ln
- 707 Crossland Dr
- 231 Lionel Dr
- 745 Dillon Ct
- 888 E Belvidere Rd Unit 311
- 888 E Belvidere Rd Unit 220
- 888 E Belvidere Rd Unit 205
- 888 E Belvidere Rd Unit 210
- 888 E Belvidere Rd Unit 124
- 888 E Belvidere Rd Unit 412
- 888 E Belvidere Rd Unit 416
- 888 E Belvidere Rd Unit 417
- 888 E Belvidere Rd Unit 414
- 888 E Belvidere Rd Unit 208
- 888 E Belvidere Rd Unit 312
- 888 E Belvidere Rd Unit 308
- 888 E Belvidere Rd Unit 224
- 888 E Belvidere Rd Unit 116
- 888 E Belvidere Rd Unit 409
- 888 E Belvidere Rd Unit 303
- 888 E Belvidere Rd Unit 316
- 888 E Belvidere Rd Unit 105
- 888 E Belvidere Rd Unit 117
- 888 E Belvidere Rd Unit 118