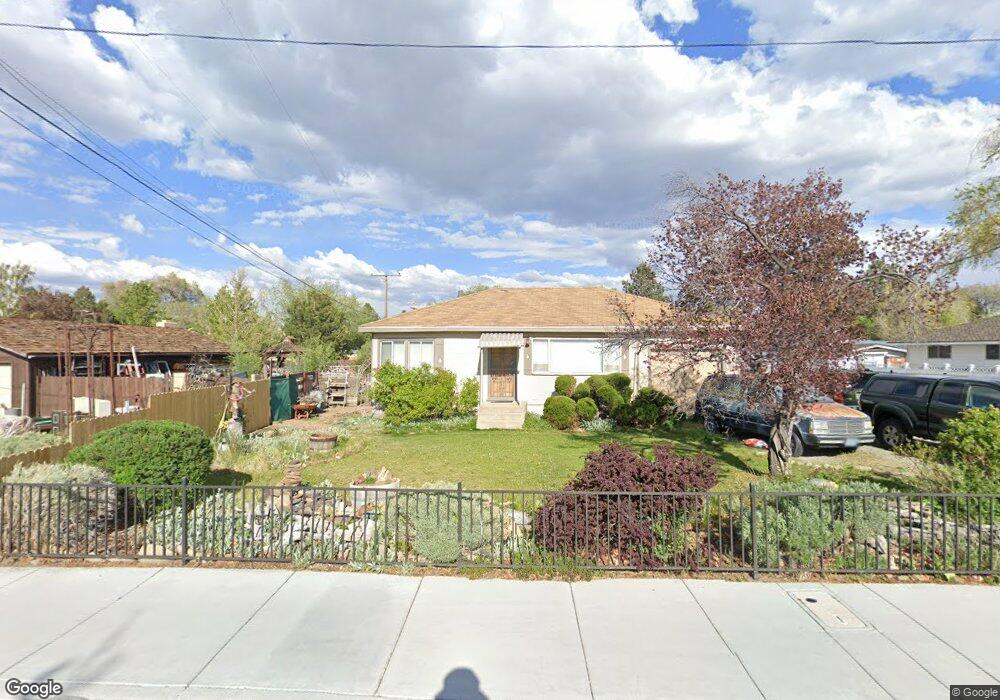
888 Keele Dr Reno, NV 89509
Mayberry NeighborhoodEstimated Value: $556,736 - $706,000
4
Beds
1
Bath
1,385
Sq Ft
$457/Sq Ft
Est. Value
About This Home
This home is located at 888 Keele Dr, Reno, NV 89509 and is currently estimated at $632,684, approximately $456 per square foot. 888 Keele Dr is a home located in Washoe County with nearby schools including Hunter Lake Elementary School, Darrell C Swope Middle School, and Reno High School.
Ownership History
Date
Name
Owned For
Owner Type
Purchase Details
Closed on
Apr 12, 2016
Sold by
Barrett David C and Barrett Karen G
Bought by
Dk Futures Llc Series B
Current Estimated Value
Purchase Details
Closed on
Jan 17, 2002
Sold by
Barrett Nancy S
Bought by
Barrett Paul M
Home Financials for this Owner
Home Financials are based on the most recent Mortgage that was taken out on this home.
Original Mortgage
$84,800
Interest Rate
7.11%
Purchase Details
Closed on
Jan 10, 2002
Sold by
Barrett Paul M
Bought by
Barrett Dave C and Barrett Karen G
Home Financials for this Owner
Home Financials are based on the most recent Mortgage that was taken out on this home.
Original Mortgage
$84,800
Interest Rate
7.11%
Purchase Details
Closed on
Nov 25, 1996
Sold by
Barrett Nancy S
Bought by
Barrett Paul M
Create a Home Valuation Report for This Property
The Home Valuation Report is an in-depth analysis detailing your home's value as well as a comparison with similar homes in the area
Home Values in the Area
Average Home Value in this Area
Purchase History
| Date | Buyer | Sale Price | Title Company |
|---|---|---|---|
| Dk Futures Llc Series B | -- | None Available | |
| Barrett David C | -- | None Available | |
| Barrett Paul M | -- | Stewart Title Northern Nevad | |
| Barrett Dave C | $106,000 | Stewart Title Northern Nevad | |
| Barrett Paul M | -- | Stewart Title | |
| Barrett Paul M | $22,500 | Stewart Title |
Source: Public Records
Mortgage History
| Date | Status | Borrower | Loan Amount |
|---|---|---|---|
| Previous Owner | Barrett Dave C | $84,800 | |
| Closed | Barrett Dave C | $10,600 |
Source: Public Records
Tax History Compared to Growth
Tax History
| Year | Tax Paid | Tax Assessment Tax Assessment Total Assessment is a certain percentage of the fair market value that is determined by local assessors to be the total taxable value of land and additions on the property. | Land | Improvement |
|---|---|---|---|---|
| 2025 | $1,064 | $77,764 | $56,926 | $20,838 |
| 2024 | $1,064 | $75,610 | $55,088 | $20,522 |
| 2023 | $1,034 | $73,461 | $54,537 | $18,924 |
| 2022 | $1,005 | $62,996 | $47,628 | $15,368 |
| 2021 | $978 | $48,101 | $33,075 | $15,026 |
| 2020 | $947 | $47,491 | $32,708 | $14,783 |
| 2019 | $920 | $42,553 | $28,996 | $13,557 |
| 2018 | $906 | $34,705 | $21,719 | $12,986 |
| 2017 | $870 | $34,481 | $21,719 | $12,762 |
| 2016 | $847 | $31,393 | $18,632 | $12,761 |
| 2015 | $843 | $26,957 | $14,369 | $12,588 |
| 2014 | $817 | $24,183 | $12,716 | $11,467 |
| 2013 | -- | $21,462 | $10,327 | $11,135 |
Source: Public Records
Map
Nearby Homes
- 1905 Von Way
- 3175 Idlewild Dr
- 615 Shamrock Ln
- 1900 Marla Dr
- 2024 Regent St
- 4000 Goodsell Ln
- 4180 Del Curto Dr
- 605 E Riverview Cir
- 4090 Goodsell Ln
- 4184 Del Curto Dr
- 4060 Goodsell Ln
- 1104 Ryegrass Ct
- 1755 Benjamin Franklin Dr
- 1510 Mayberry Dr
- 1460 Shewmaker Ct
- 2875 Idlewild Dr Unit 91
- 2875 Idlewild Dr Unit 51
- 2875 Idlewild Dr Unit 14
- 2195 W Plumb Ln
- 2240 W Plumb Ln