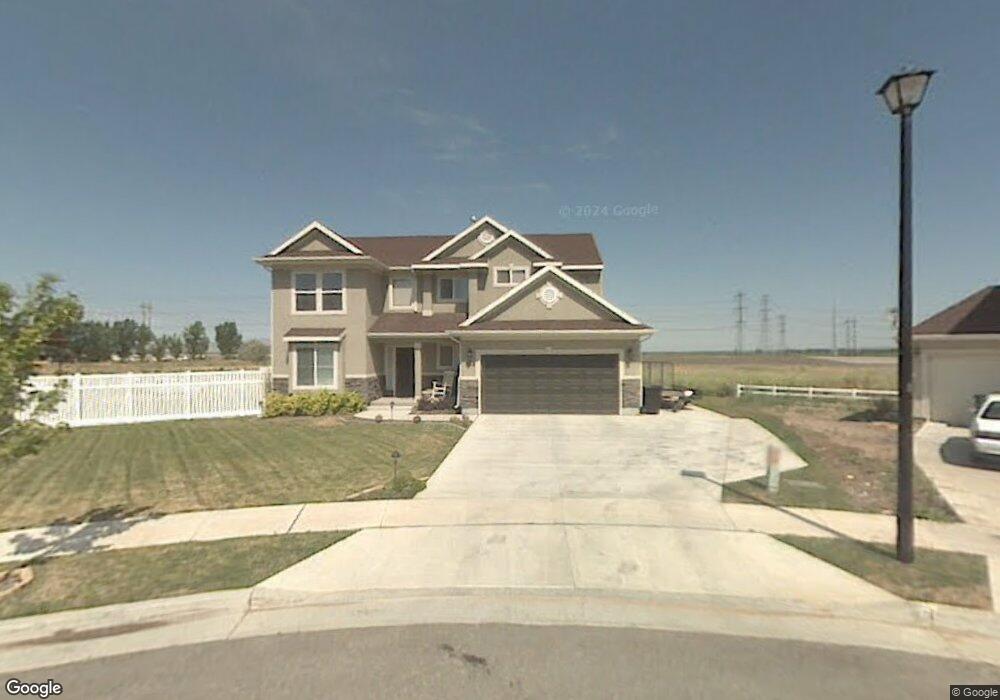
888 W 2310 N West Bountiful, UT 84087
Estimated Value: $584,000 - $628,000
3
Beds
3
Baths
2,199
Sq Ft
$276/Sq Ft
Est. Value
About This Home
This home is located at 888 W 2310 N, West Bountiful, UT 84087 and is currently estimated at $606,946, approximately $276 per square foot. 888 W 2310 N is a home located in Davis County with nearby schools including West Bountiful Elementary School, Bountiful Junior High School, and Viewmont High School.
Ownership History
Date
Name
Owned For
Owner Type
Purchase Details
Closed on
Feb 28, 2025
Sold by
Kellen Frey And Kari Frey Trust and Frey Kellen
Bought by
Casita Linda Llc
Current Estimated Value
Purchase Details
Closed on
Jun 29, 2007
Sold by
Meacham Brittany S
Bought by
Frey Kellen and Frey Karl
Home Financials for this Owner
Home Financials are based on the most recent Mortgage that was taken out on this home.
Original Mortgage
$239,200
Interest Rate
6%
Mortgage Type
Purchase Money Mortgage
Purchase Details
Closed on
Mar 11, 2005
Sold by
Argyle Acres Llc
Bought by
Meacham Brittany S
Home Financials for this Owner
Home Financials are based on the most recent Mortgage that was taken out on this home.
Original Mortgage
$31,900
Interest Rate
5.65%
Mortgage Type
Purchase Money Mortgage
Create a Home Valuation Report for This Property
The Home Valuation Report is an in-depth analysis detailing your home's value as well as a comparison with similar homes in the area
Home Values in the Area
Average Home Value in this Area
Purchase History
| Date | Buyer | Sale Price | Title Company |
|---|---|---|---|
| Casita Linda Llc | -- | None Listed On Document | |
| Casita Linda Llc | -- | None Listed On Document | |
| Frey Kellen | -- | First American Title | |
| Meacham Brittany S | -- | Us Title Co |
Source: Public Records
Mortgage History
| Date | Status | Borrower | Loan Amount |
|---|---|---|---|
| Previous Owner | Frey Kellen | $239,200 | |
| Previous Owner | Meacham Brittany S | $31,900 |
Source: Public Records
Tax History
| Year | Tax Paid | Tax Assessment Tax Assessment Total Assessment is a certain percentage of the fair market value that is determined by local assessors to be the total taxable value of land and additions on the property. | Land | Improvement |
|---|---|---|---|---|
| 2025 | $3,531 | $300,850 | $150,987 | $149,863 |
| 2024 | $3,553 | $310,750 | $124,274 | $186,476 |
| 2023 | $3,421 | $547,000 | $234,284 | $312,716 |
| 2022 | $3,508 | $314,600 | $113,020 | $201,580 |
| 2021 | $3,091 | $423,000 | $153,666 | $269,334 |
| 2020 | $2,758 | $372,000 | $141,636 | $230,364 |
| 2019 | $2,725 | $364,000 | $142,162 | $221,838 |
| 2018 | $2,541 | $334,000 | $141,223 | $192,777 |
| 2016 | $2,166 | $153,945 | $38,103 | $115,842 |
| 2015 | $2,183 | $146,960 | $38,103 | $108,857 |
| 2014 | $2,567 | $154,000 | $38,103 | $115,897 |
| 2013 | -- | $119,225 | $25,519 | $93,706 |
Source: Public Records
Map
Nearby Homes
- 2257 N 830 W
- 2339 N 800 W
- 2093 N 750 W
- 680 W 2350 N
- 988 W 1950 N Unit 134
- 789 W 1950 N
- 1084 W Audrey Ln Unit 20
- 1084 W Audrey Ln
- 1767 N 600 W
- 287 S 680 W Unit 9
- 825 W 1320 N
- 324 S 600 W
- 1520 N 550 W
- 1625 Pages Place
- 638 N 800 W
- 328 W Pages Ln
- 204 Lyman Ln
- 147 N 360 W Unit 21
- 330 W Paradiso Ln
- 507 W 620 N
Your Personal Tour Guide
Ask me questions while you tour the home.