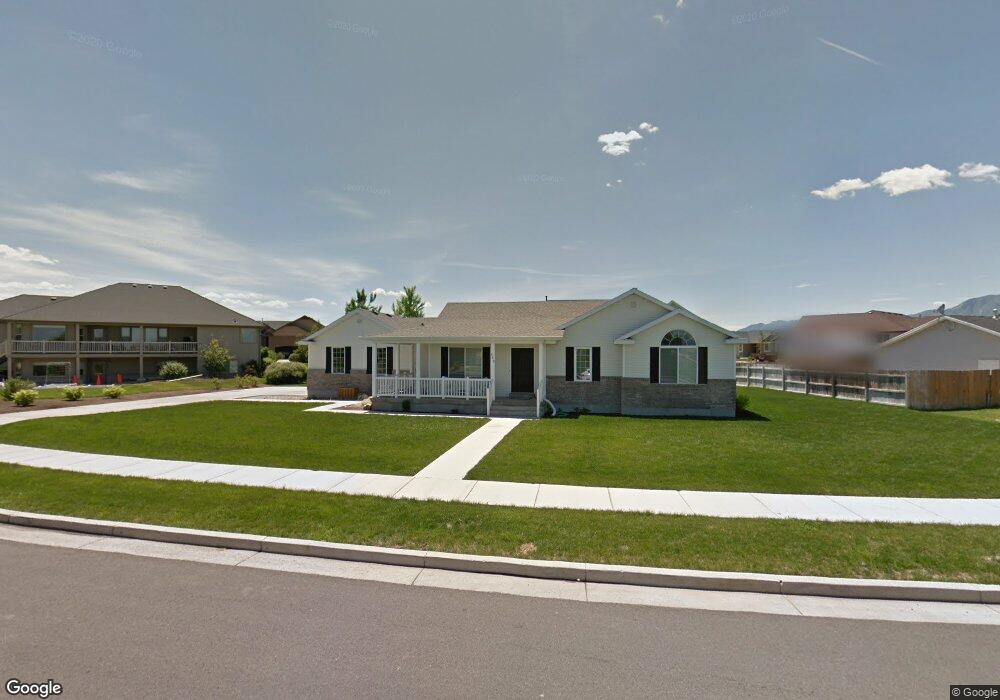
888 W 2450 S Nibley, UT 84321
Estimated Value: $401,564 - $454,000
3
Beds
2
Baths
1,430
Sq Ft
$295/Sq Ft
Est. Value
About This Home
This home is located at 888 W 2450 S, Nibley, UT 84321 and is currently estimated at $421,891, approximately $295 per square foot. 888 W 2450 S is a home located in Cache County with nearby schools including Nibley School, Spring Creek Middle School, and South Cache Middle School.
Ownership History
Date
Name
Owned For
Owner Type
Purchase Details
Closed on
Nov 14, 2014
Sold by
Farmer Adam W and Farmer Erica M
Bought by
Farmer Erica S and Farmer Adam W
Current Estimated Value
Home Financials for this Owner
Home Financials are based on the most recent Mortgage that was taken out on this home.
Original Mortgage
$159,600
Outstanding Balance
$122,709
Interest Rate
4.1%
Mortgage Type
New Conventional
Estimated Equity
$299,183
Purchase Details
Closed on
Sep 8, 2005
Sold by
Durham Ronald and Musacchia Dave
Bought by
Farmer Adam W and Farmer Erica M
Home Financials for this Owner
Home Financials are based on the most recent Mortgage that was taken out on this home.
Original Mortgage
$9,500
Interest Rate
5.81%
Mortgage Type
Unknown
Purchase Details
Closed on
Jun 30, 2005
Sold by
Nibley Park Estates Llc
Bought by
Durham Roland and Musacchia Dave
Home Financials for this Owner
Home Financials are based on the most recent Mortgage that was taken out on this home.
Original Mortgage
$96,000
Interest Rate
5.65%
Mortgage Type
Purchase Money Mortgage
Create a Home Valuation Report for This Property
The Home Valuation Report is an in-depth analysis detailing your home's value as well as a comparison with similar homes in the area
Home Values in the Area
Average Home Value in this Area
Purchase History
| Date | Buyer | Sale Price | Title Company |
|---|---|---|---|
| Farmer Erica S | -- | Cache Title | |
| Farmer Adam W | -- | Northern Title Company | |
| Durham Roland | -- | Cache Title Company |
Source: Public Records
Mortgage History
| Date | Status | Borrower | Loan Amount |
|---|---|---|---|
| Open | Farmer Erica S | $159,600 | |
| Closed | Farmer Adam W | $9,500 | |
| Closed | Farmer Adam W | $157,000 | |
| Previous Owner | Durham Roland | $96,000 |
Source: Public Records
Tax History Compared to Growth
Tax History
| Year | Tax Paid | Tax Assessment Tax Assessment Total Assessment is a certain percentage of the fair market value that is determined by local assessors to be the total taxable value of land and additions on the property. | Land | Improvement |
|---|---|---|---|---|
| 2024 | $1,509 | $187,785 | $0 | $0 |
| 2023 | $1,573 | $183,300 | $0 | $0 |
| 2022 | $1,637 | $183,300 | $0 | $0 |
| 2021 | $1,608 | $279,620 | $65,000 | $214,620 |
| 2020 | $1,343 | $222,366 | $65,000 | $157,366 |
| 2019 | $1,409 | $222,366 | $65,000 | $157,366 |
| 2018 | $1,181 | $181,840 | $45,000 | $136,840 |
| 2017 | $1,142 | $93,170 | $0 | $0 |
| 2016 | $1,155 | $93,170 | $0 | $0 |
| 2015 | $1,019 | $82,750 | $0 | $0 |
| 2014 | $996 | $82,750 | $0 | $0 |
| 2013 | -- | $90,175 | $0 | $0 |
Source: Public Records
Map
Nearby Homes
- 1045 W 2400 S
- 2662 S 850 W
- 2269 Clear Creek Rd
- 2313 S 1000 W Unit 110
- 2243 S 1120 W Unit 58
- 2205 S 1120 W Unit 62
- 1065 W 2740 S
- 2615 S 600 W
- 2203 S 1150 W Unit 43
- 3074 S 800 W
- 2485 S 1296 W
- Briarwood Plan at Firefly Estates
- Phoenix Plan at Firefly Estates
- Hailey Plan at Firefly Estates
- Stansbury Plan at Firefly Estates
- Monroe Plan at Firefly Estates
- Chateau Plan at Firefly Estates
- Alpine Plan at Firefly Estates
- Gala Plan at Firefly Estates
- McIntosh Plan at Firefly Estates
- 888 Nibley Park Ave
- 895 Parkview Cir
- 2453 Parkview Cir
- 904 W Nibley Park Ave
- 904 W 2450 S
- 904 Nibley Park Ave
- 915 Parkview Cir
- 905 Nibley Park Ave Unit 25
- 905 W 2450 S Unit 25
- 924 W 2450 S
- 890 Park View Cir
- 874 Parkview Cir
- 923 W 2450 S
- 920 Parkview Cir
- 860 Parkview Cir Unit 4
- 908 Park View Cir
- 844 W 2450 S
- 860 Parkview Cir
- 2460 S 960 W
- 2452 S 960 W