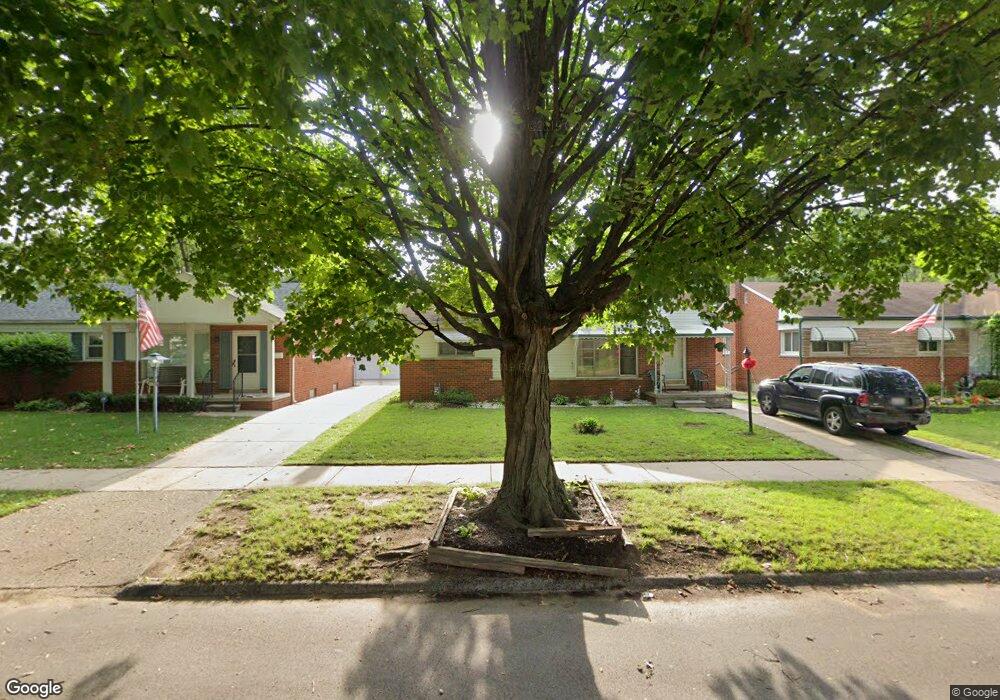
8880 Dixie Redford, MI 48239
Estimated Value: $187,007 - $220,000
3
Beds
2
Baths
1,083
Sq Ft
$189/Sq Ft
Est. Value
About This Home
This home is located at 8880 Dixie, Redford, MI 48239 and is currently estimated at $205,002, approximately $189 per square foot. 8880 Dixie is a home located in Wayne County with nearby schools including John D. Pierce Middle School, Lee M. Thurston High School, and Global Heights Academy.
Ownership History
Date
Name
Owned For
Owner Type
Purchase Details
Closed on
Apr 23, 2012
Sold by
Izairi Skender
Bought by
Great Scott Holdings Llc
Current Estimated Value
Purchase Details
Closed on
Apr 20, 2011
Sold by
Fannie Mae
Bought by
Izairi Skender
Purchase Details
Closed on
May 4, 2010
Sold by
Bac Home Loans Servicing Lp
Bought by
Federal National Mortgage Association
Purchase Details
Closed on
Apr 28, 2010
Sold by
Kostecki Gary and Kostecki Pamella
Bought by
Bac Home Loans Servicing Lp
Create a Home Valuation Report for This Property
The Home Valuation Report is an in-depth analysis detailing your home's value as well as a comparison with similar homes in the area
Home Values in the Area
Average Home Value in this Area
Purchase History
| Date | Buyer | Sale Price | Title Company |
|---|---|---|---|
| Great Scott Holdings Llc | -- | None Available | |
| Izairi Skender | $26,100 | Attorneys Title Agency Llc | |
| Federal National Mortgage Association | -- | None Available | |
| Bac Home Loans Servicing Lp | $124,844 | None Available |
Source: Public Records
Tax History Compared to Growth
Tax History
| Year | Tax Paid | Tax Assessment Tax Assessment Total Assessment is a certain percentage of the fair market value that is determined by local assessors to be the total taxable value of land and additions on the property. | Land | Improvement |
|---|---|---|---|---|
| 2025 | $1,055 | $86,800 | $0 | $0 |
| 2024 | $1,055 | $80,200 | $0 | $0 |
| 2023 | $1,008 | $71,400 | $0 | $0 |
| 2022 | $2,669 | $63,200 | $0 | $0 |
| 2021 | $2,505 | $58,700 | $0 | $0 |
| 2020 | $2,471 | $49,800 | $0 | $0 |
| 2019 | $2,420 | $44,000 | $0 | $0 |
| 2018 | $867 | $36,600 | $0 | $0 |
| 2017 | $2,632 | $34,200 | $0 | $0 |
| 2016 | $2,153 | $34,800 | $0 | $0 |
| 2015 | $2,612 | $31,700 | $0 | $0 |
| 2013 | $2,530 | $25,800 | $0 | $0 |
| 2012 | $2,112 | $28,300 | $7,500 | $20,800 |
Source: Public Records
Map
Nearby Homes